Statistics - Vocabulary
Maths Resource Description
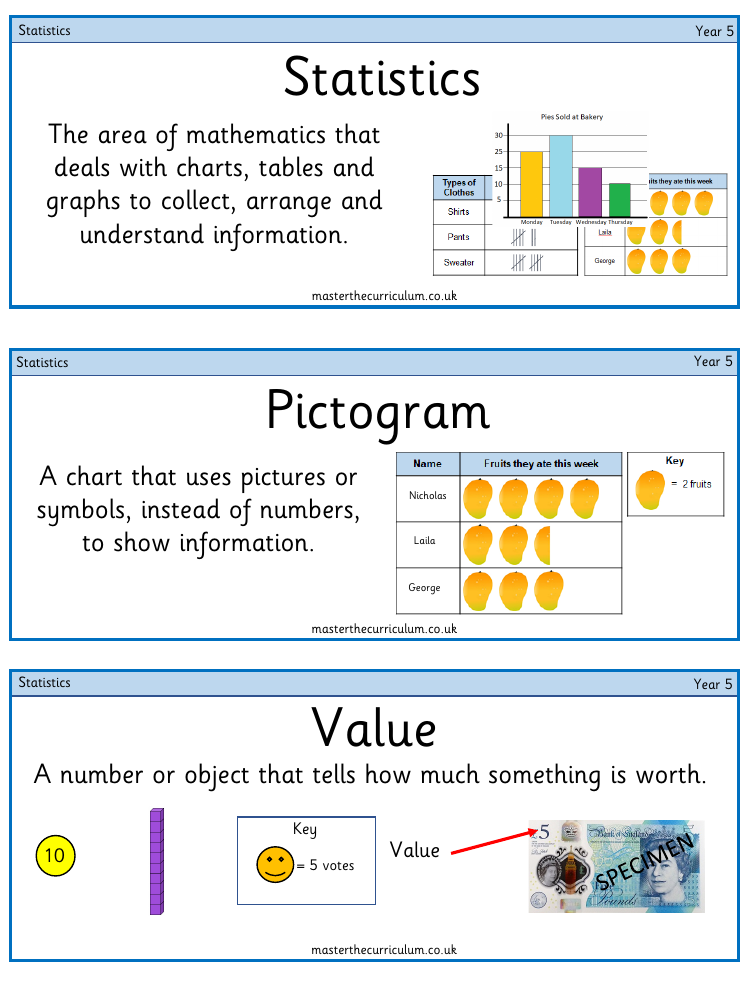
A pictogram is a type of chart that utilises pictures or symbols to represent data, offering a visual alternative to numerical representation. Each symbol in a pictogram corresponds to a specific quantity, as defined by the key, which explains the value of each symbol. For example, a single image might represent five votes. This method of presenting information is particularly useful in helping children visualise quantities and understand data in a more accessible way. Similarly, a bar chart employs bars of varying heights to show values of different items, with a scale on the side indicating the range of values and intervals marking the increments between the lines on the scale.
Statistics is a branch of mathematics that involves collecting, organising, and interpreting data through the use of charts, tables, and graphs. Year 5 students learn to handle various forms of data, such as discrete data, which can only take certain values and is countable. They also learn to interpret data, understanding terms like 'most popular' and 'least popular' based on the results from collected data. The curriculum introduces them to a range of tools for presenting data, including tally charts, tables, and line graphs. A tally chart, for instance, uses lines to count and record information efficiently, while a line graph connects points with lines to show changes over time. Understanding these concepts enables students to perform tasks such as summing totals, making comparisons, and identifying differences within datasets.