Statistics - Assessment
Maths Resource Description
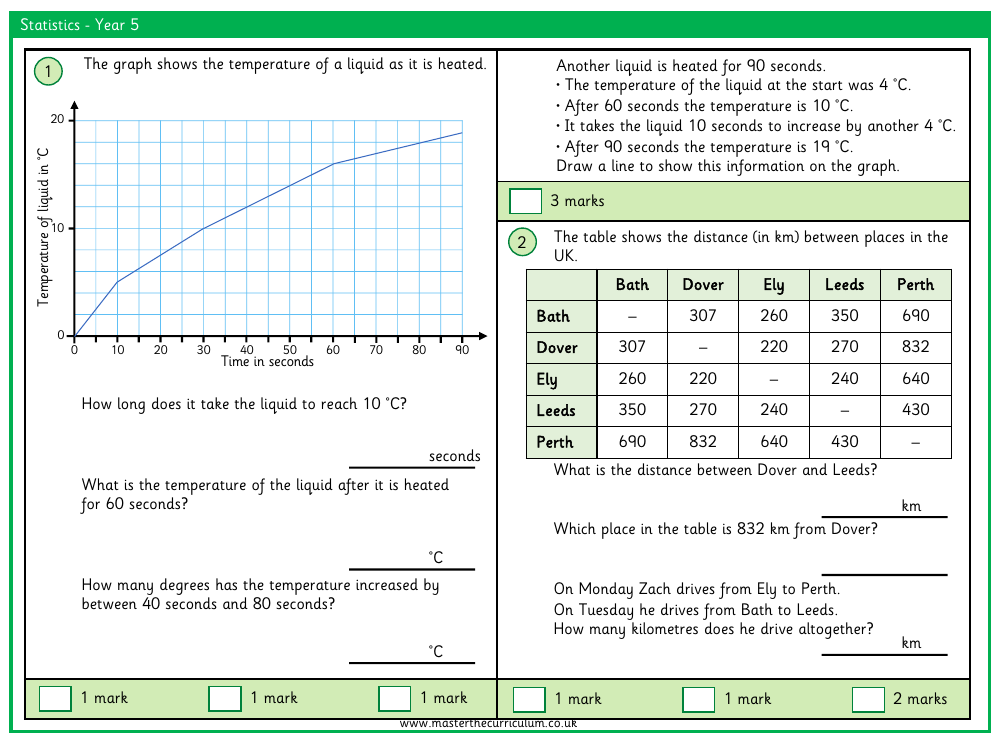
The statistical assessment for Year 5 students includes a variety of questions that test their ability to interpret data and perform calculations based on given information. For instance, they are asked to determine the distance between Dover and Leeds, which is 270 km according to the provided table. Additionally, they must identify which place is 832 km from Dover, which is Perth. The assessment also includes a real-life scenario where Zach drives from Ely to Perth on Monday and from Bath to Leeds on Tuesday, with students required to calculate the total distance driven, which is 990 km.
Another section of the assessment involves interpreting a graph that charts the temperature change of a liquid over time. Students must draw a line on the graph to represent the temperature increase of another liquid from 4 ˚C to 19 ˚C over 90 seconds. They are also tasked with answering questions such as the time taken for the liquid to reach 10 ˚C, which is 60 seconds, and the temperature increase between 40 and 80 seconds, which is 6 ˚C. Furthermore, the assessment includes questions about film start times at a cinema and the sale of different types of sandwiches, requiring students to demonstrate their understanding of time calculations and data analysis.