Statistics - Use Line Graphs to Solve Problems - Worksheet
Maths Resource Description
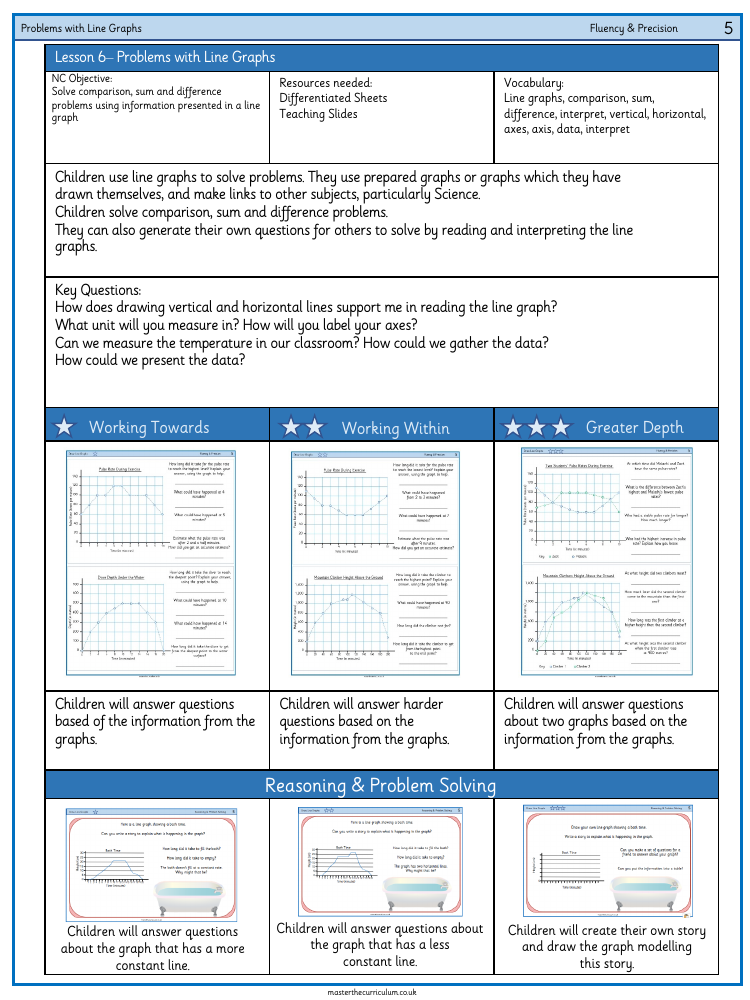
In this educational activity, Year 6 students are tasked with mastering the interpretation and problem-solving skills associated with line graphs. The National Curriculum objective is to solve comparison, sum, and difference problems using information presented in a line graph. To achieve this, students are supplied with differentiated worksheets and teaching slides that cater to various levels of understanding. The lesson incorporates key vocabulary such as 'line graphs', 'comparison', 'sum', 'difference', 'interpret', and 'axes', ensuring students become fluent in the language of data representation. Through engaging with line graphs, children not only apply their mathematical skills but also integrate knowledge from other subjects, particularly science, making the activity cross-curricular.
Students are encouraged to answer a range of questions, starting from basic interpretation to more complex queries that require a deeper understanding of the data presented. They are asked to consider the implications of drawing vertical and horizontal lines when reading a line graph and to think critically about the units and labelling of axes. The activities also prompt students to consider practical applications, such as measuring and presenting classroom temperature data. For those reaching greater depth, the challenge is to create their own story and corresponding line graph, further enhancing their analytical and creative skills. The worksheet facilitates reasoning and problem-solving, with a focus on fluency and precision, allowing students to demonstrate their ability to draw and interpret line graphs in a variety of contexts.

