Statistics - Use Line Graphs to Solve Problems - Planning
Maths Resource Description
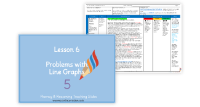
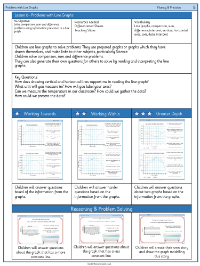
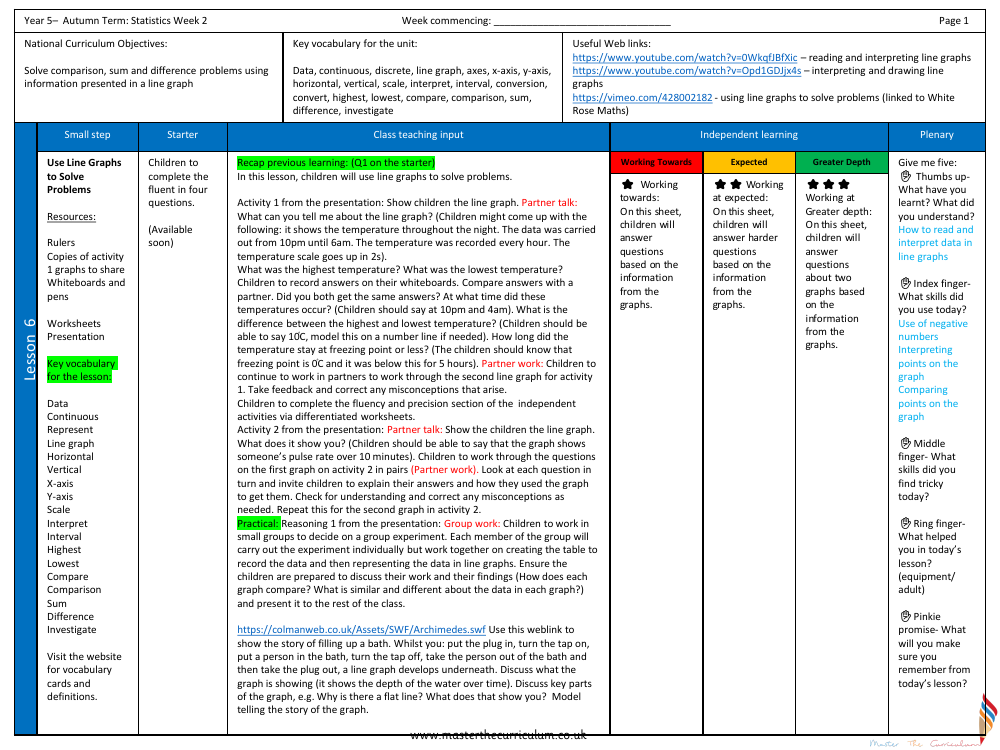
The Autumn Term for Year 5 students includes a week dedicated to Statistics, focusing on the use of line graphs to solve comparison, sum, and difference problems. Pupils are introduced to key vocabulary such as 'data', 'continuous', 'line graph', and 'scale', which are essential for understanding and interpreting graphs. The lesson plan encourages the use of rulers, whiteboards, and pens alongside provided worksheets and a presentation to facilitate learning. During the lesson, children are expected to engage in activities that involve reading and interpreting data from line graphs, recording their findings, and discussing outcomes with their peers to correct any misunderstandings. This interactive approach helps the students develop their analytical skills by comparing and contrasting different sets of data and understanding the significance of the highest and lowest points on the graph.
As the lesson progresses, children work in groups to conduct experiments, record the data, and represent it in line graphs. This practical application of their learning enables them to explore real-world scenarios, such as the changing depth of water in a bath over time, which is demonstrated through an interactive online story. The lesson plan also addresses potential misconceptions, such as reading from the wrong axis, and includes differentiated worksheets to cater to varying levels of understanding. Through activities like reasoning and partner discussions, students are encouraged to think critically about the information presented in line graphs and to narrate the stories behind the data. By the end of the session, the aim is for the children to have a stronger grasp of interpreting line graphs and to apply this knowledge to different contexts.

