Statistics - Draw Line Graphs - Worksheet
Maths Resource Description
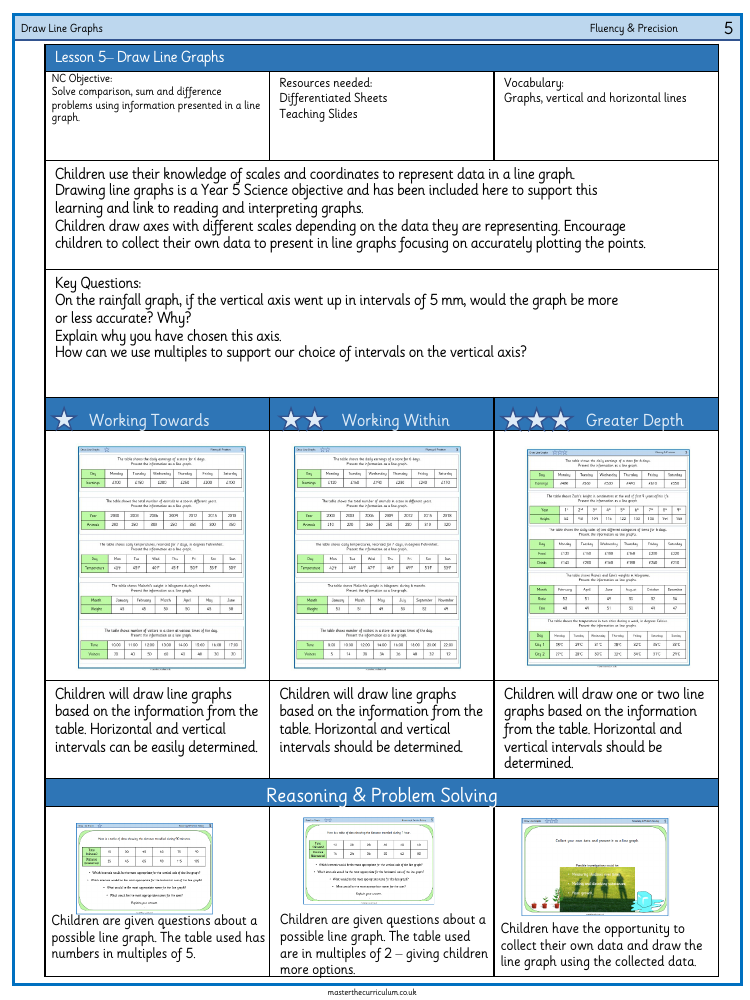
The "Draw Line Graphs" worksheet is an educational resource aimed at enhancing students' abilities in interpreting and presenting data through line graphs. It aligns with the National Curriculum objective to solve comparison, sum, and difference problems using information depicted in a line graph. To support the learning process, differentiated sheets and teaching slides are provided, along with a set of key vocabulary terms such as graphs, vertical and horizontal lines. Students are encouraged to draw upon their understanding of scales and coordinates to accurately plot data points on a line graph. This task is particularly relevant for Year 5 Science students, as it complements their objectives related to graph reading and interpretation.
Throughout the worksheet, students are presented with various data tables that they must represent as line graphs, taking into account appropriate scales for both horizontal and vertical intervals. The exercises include data ranging from daily earnings of a store to the total number of animals in a zoo over different years, as well as temperature recordings and individual weight measurements over time. The tasks are designed to challenge students at different levels of proficiency, from those working towards the expected standard to those demonstrating greater depth in their understanding. Additionally, students are prompted to collect their own data for graphing, which could involve scientific investigations such as measuring shadows, observing melting and dissolving substances, or monitoring plant growth. This hands-on approach fosters analytical thinking and practical application of mathematical concepts.

