Statistics - Draw Line Graphs - Starter

Maths Resource Description
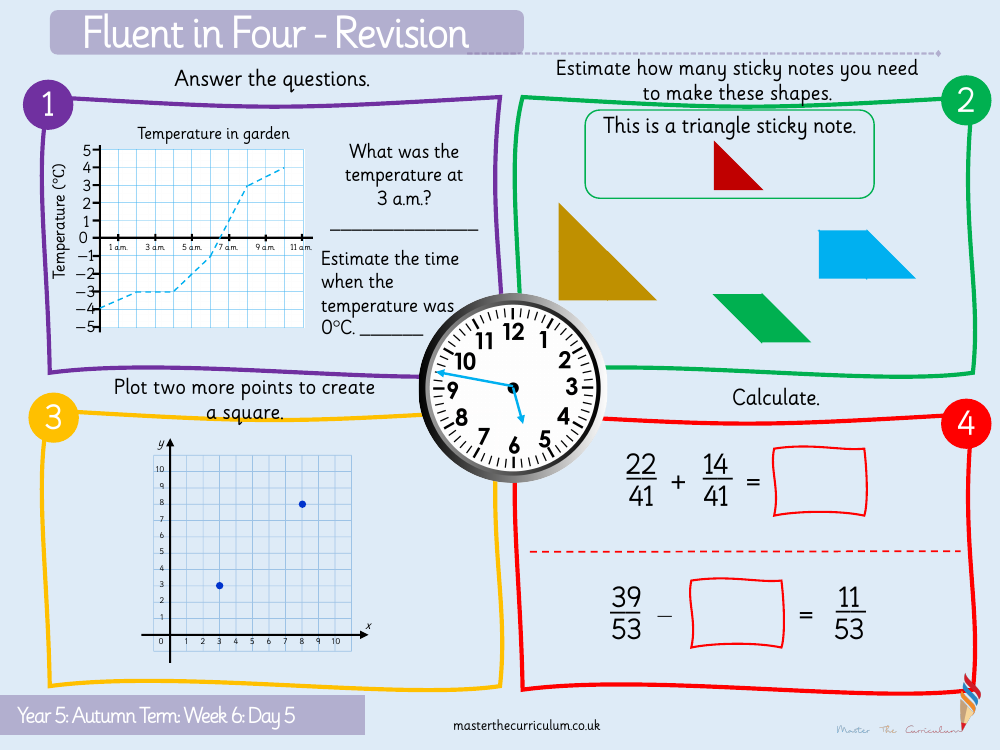
In an engaging mathematics session for Year 5 students during Autumn Term's Week 6, Day 5, the focus is on enhancing their understanding of statistics through practical activities involving line graphs. The lesson starts with a 'Fluent in Four - Revision' task where students are challenged to plot points on a coordinate grid to form a square, reinforcing their knowledge of shapes and spatial awareness. Following this, they are tasked with estimating the number of sticky notes required to create certain shapes, which merges visual estimation skills with practical application.
The lesson progresses with a series of calculations that students must complete, involving basic arithmetic operations such as addition, subtraction, and comparison of numbers. Additionally, students are presented with a real-life scenario where they analyse a line graph showing the temperature in a garden over time. They are required to estimate the time when the temperature reached 0°C and to determine the temperature at a specific time, such as 3 a.m. This activity not only tests their ability to interpret data from a graph but also connects mathematical concepts to everyday situations, enhancing their problem-solving and critical thinking skills.


