Statistics - Read and Interpret Tables - Presentation
Maths Resource Description
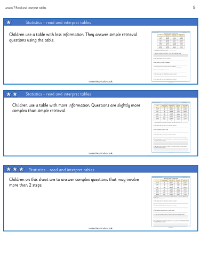
The provided text outlines a series of educational slides focused on teaching students how to read and interpret tables, a crucial skill in understanding and analyzing data. The lesson begins with prompting students to think about the types of information commonly presented in tables and to recall instances where they have encountered data in this format. The slides then delve into specific activities where students are presented with tables containing various statistics about the planets in our solar system. They are asked to answer questions that require them to understand the significance of column and row headings, such as identifying the planets' diameters, revolution and rotation times, and comparing these figures to draw conclusions.
Further activities expand on these skills by presenting tables with data on the distances of planets from the sun, as well as population statistics for different cities. Students are tasked with exercises such as calculating differences, combining figures to reach specified totals, and formulating their own questions based on the data. Additionally, the lesson includes reasoning tasks where students must analyze statements for their validity, such as comparing the capacities of Europe's largest football stadiums. The importance of using correct units of measure and operations when finding differences is also highlighted, ensuring students understand the comprehensive approach required for accurate data interpretation.

