Statistics - Vocabulary
Maths Resource Description
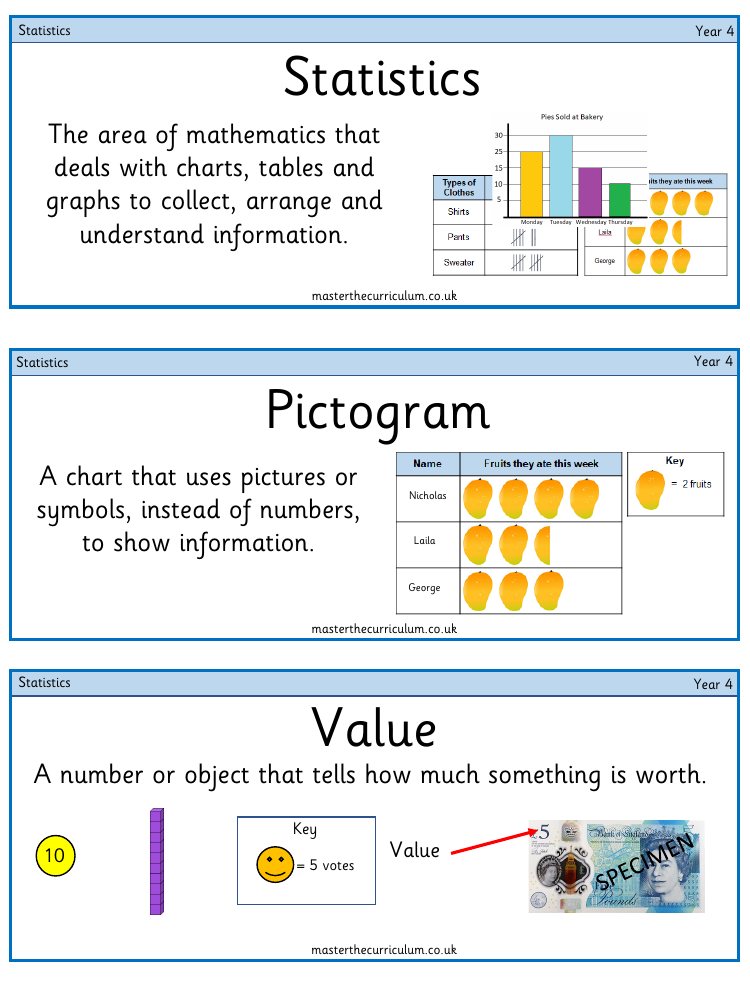
A pictogram is an illustrative chart where pictures or symbols are used to represent information instead of numerical figures. This visual method makes it easier to understand data at a glance. The term 'value' refers to a numerical quantity or object that signifies the worth of something. In the context of statistics, especially for Year 4 students, the subject encompasses the use of charts, tables, and graphs to collect, organise, and interpret information, facilitating a better comprehension of the data presented.
Key statistical concepts include understanding the 'result', which is the final outcome of an analysis or collection of data. Symbols play a crucial role in pictograms, serving as representations that convey specific meanings, such as a symbol equating to a certain number of votes. The 'key' of a pictogram is an explanatory component that communicates the value of each symbol used within the chart. Additionally, the term 'data' refers to information related to entities such as individuals or locations, and it is essential to handle personal data with care. 'Interpretation' is the process of making sense of the information provided, which is a fundamental skill in the study of statistics. Bar charts, which utilise bars of varying heights to display different values, are another common tool in the statistical arsenal, enabling the comparison of quantities and the identification of popular or unpopular items based on the data collected.