Statistics - Assessment
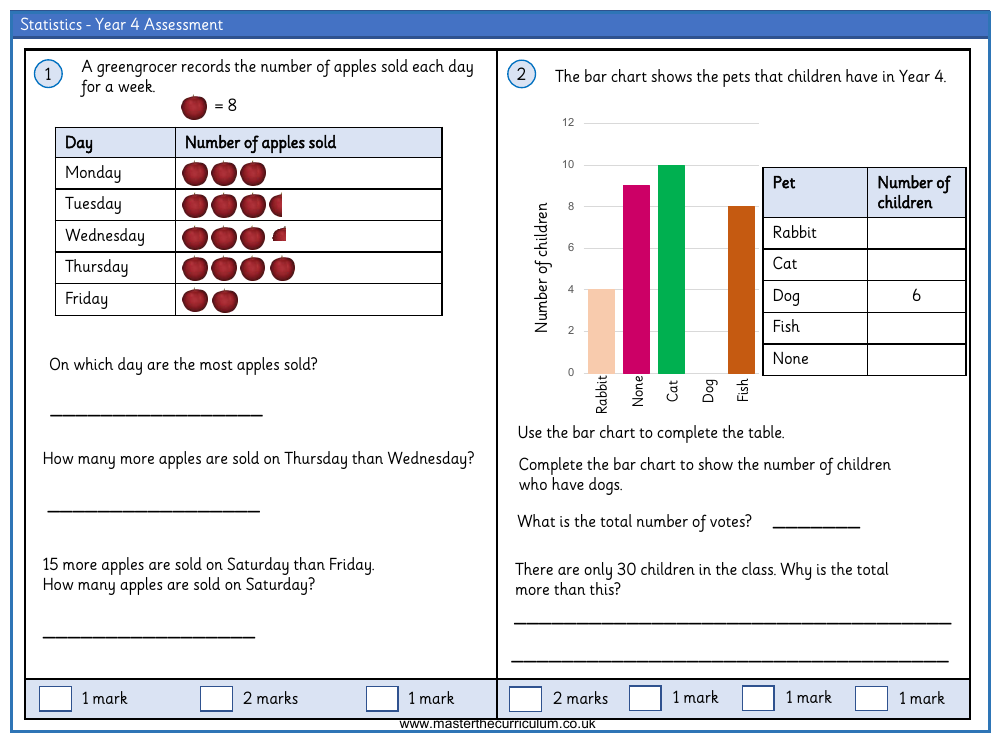
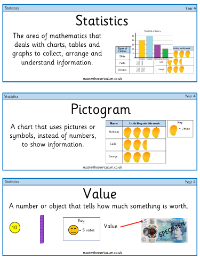
Maths Resource Description
In the Year 4 assessment for Statistics, students are presented with a variety of data interpretation challenges. One task involves analysing a greengrocer's record of apple sales over a week, where students must identify the day with the highest sales and calculate differences in sales between specific days. Additionally, they are asked to infer the number of apples sold on Saturday based on the given increment from Friday's sales. Another component of the assessment includes interpreting a bar chart that depicts the types of pets owned by children in Year 4. Pupils must use the visual information to complete a table and adjust the bar chart to reflect the number of children with dogs. They are also tasked with calculating the total number of pets and discussing why this total may exceed the number of children in the class.
The assessment continues with a section on confidence in statistics, where students are encouraged to self-assess their skills. Further exercises include analysing attendance figures at a bounce park, determining which bounce had the least number of visitors at a specific time, and calculating the increase in visitors during different times of the day. Another part of the assessment focuses on the growth of a giant sunflower, where students must read a line graph to find the height of the sunflower in June, the difference in height between March and July, and the growth in centimetres from February to March. This comprehensive assessment tests students' abilities to interpret data, perform calculations, and understand graphical representations within a real-world context.