Statistics - Assessment
Maths Resource Description
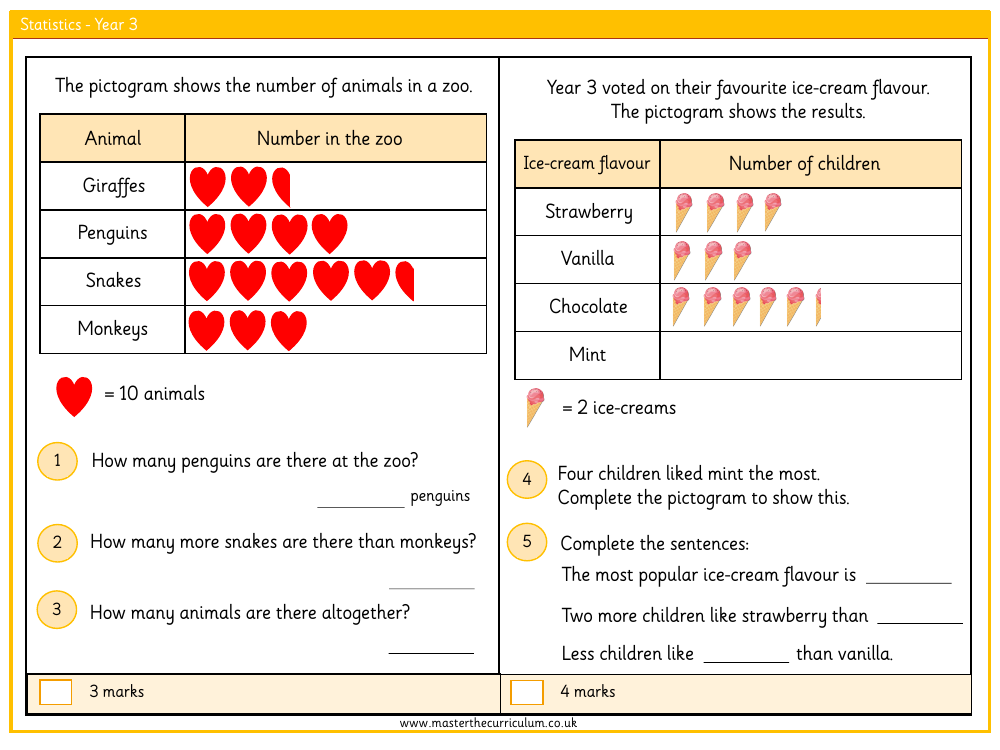
In an engaging Year 3 statistics assessment, pupils are tasked with interpreting data from pictograms, focusing on the context of zoo animals and ice-cream flavour preferences. The assessment requires students to analyse the pictograms to determine the number of animals of different species in a zoo and the number of children who favour various ice-cream flavours. For instance, they must calculate the difference in the number of snakes compared to monkeys and the total number of animals present at the zoo. Additionally, they are asked to update the pictogram to reflect that four children prefer mint ice-cream, ensuring the visual representation matches the provided data.
The assessment continues with further questions that delve into the popularity of ice-cream flavours among the students. Children are asked to identify which flavour is the most popular by examining the pictogram. They must also compare the number of children who like strawberry to those who prefer other flavours, and determine which flavour is liked by fewer children than vanilla. The assessment provides an opportunity for Year 3 students to apply their knowledge of statistics and data interpretation in a practical and relatable context, while also demonstrating their understanding of numerical relationships and differences.