Statistics - Draw bar charts activity - Worksheet
Maths Resource Description
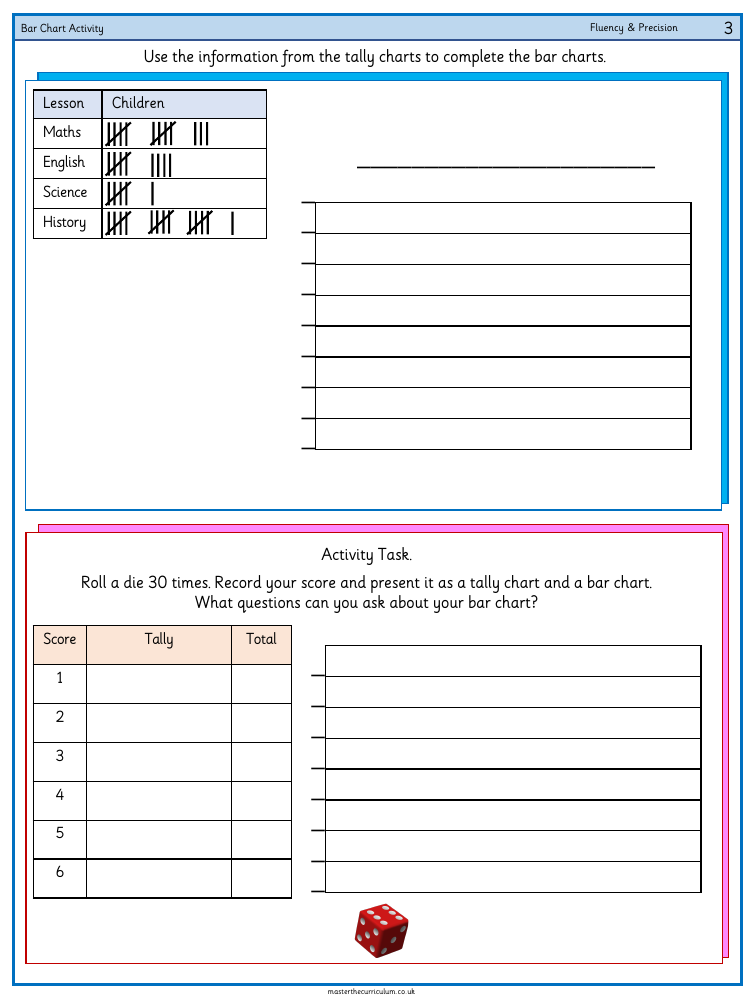
This worksheet, designed to enhance fluency and precision, provides an engaging activity for children to practice their data handling skills. The task requires students to roll a die 30 times, carefully record each score, and represent the outcomes using both tally charts and bar charts. The initial part of the worksheet presents a list of subjects—Maths, English, Science, and History—next to blank spaces, likely intended for children to fill in with corresponding data before creating bar charts.
For the activity, the worksheet has a section labelled 'Score Tally Total' with numbers 1 to 6, representing the possible outcomes of each die roll. Children are instructed to tally the frequency of each score as they roll the die. After completing 30 rolls and tallying the results, they must then translate this data into a bar chart, accurately reflecting the total counts for each score. The activity concludes with a prompt for students to formulate questions regarding their bar chart, which encourages critical thinking and helps them to interpret and discuss the data they have collected and presented.

