Statistics - Draw Pictograms 1-1 - Planning
Maths Resource Description
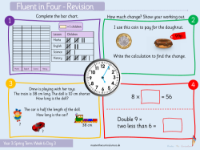
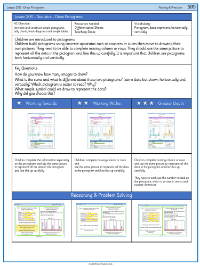
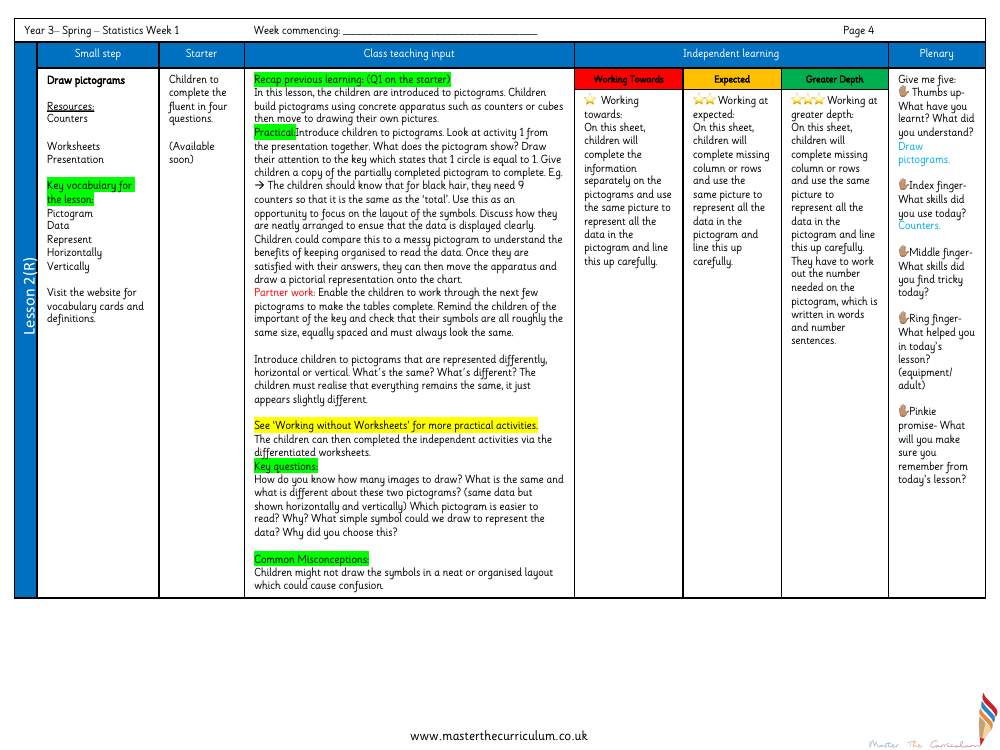
In a Year 3 statistics lesson, students embark on learning how to draw pictograms. The lesson utilises a variety of resources, including counters, worksheets, and a presentation to engage the children in creating visual representations of data. The key vocabulary introduced includes terms such as 'pictogram', 'data', 'represent', 'horizontally', and 'vertically', with additional resources available to help with understanding these concepts. The lesson begins with a starter activity that prompts students to recall prior knowledge before moving on to practical exercises where they use counters to build pictograms, emphasising the importance of a neat layout to clearly display data.
Following the hands-on experience, children are encouraged to work in pairs to complete further pictograms, paying careful attention to the uniformity and spacing of their symbols as guided by a key. The lesson also introduces variations in pictogram orientation, challenging students to identify similarities and differences between horizontal and vertical representations. Through independent work on differentiated worksheets and practical activities, the students are tasked with completing pictograms and understanding the significance of the key. The plenary includes reflective questions to consolidate learning and address common misconceptions, such as disorganised symbol arrangement. The lesson concludes with a 'Give me five' activity where students reflect on their learning, the skills they've used and found challenging, and the resources that supported them, ensuring they remember the key aspects of drawing accurate pictograms.