Statistics - Draw pictograms - Worksheet
Maths Resource Description
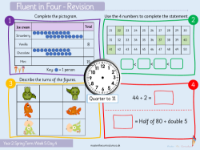
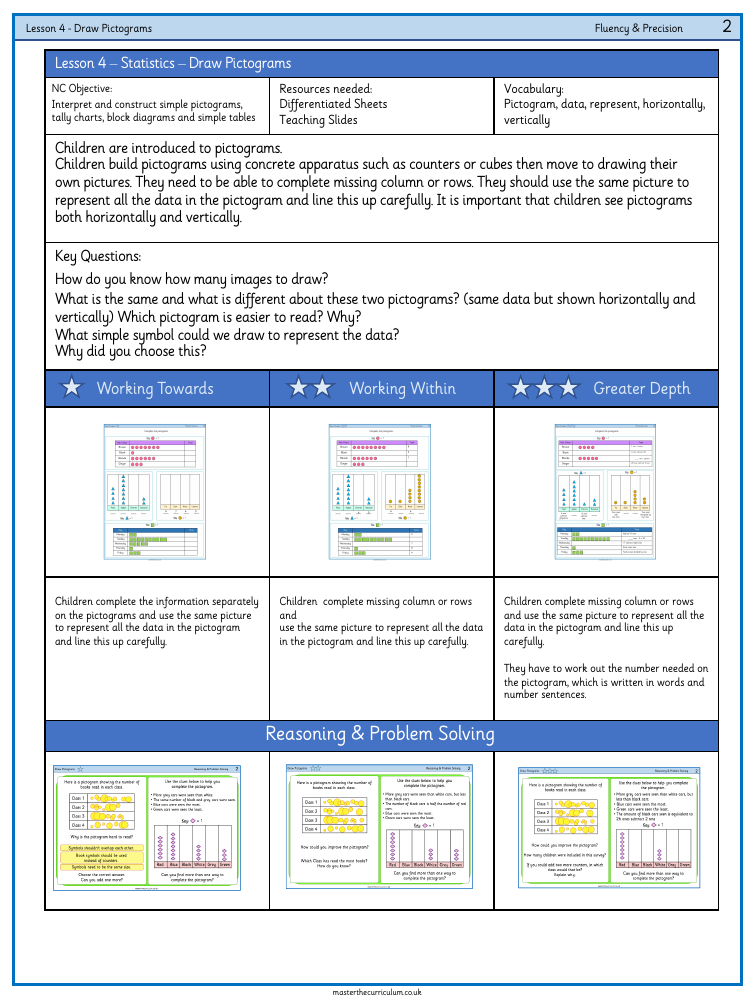
In the fourth lesson on Statistics, Year 6 students are tasked with interpreting and constructing simple pictograms, as well as tally charts, block diagrams, and tables. This lesson is part of the National Curriculum objective to build foundational skills in handling data. To facilitate the learning process, differentiated worksheets and teaching slides are provided as resources. The key vocabulary for this lesson includes terms such as 'pictogram', 'data', 'represent', 'horizontally', and 'vertically'. Students start by using tangible objects like counters or cubes to create pictograms, then progress to drawing their own. It is crucial for them to understand the importance of uniformity in the symbols used and the alignment of the data, whether the pictograms are displayed horizontally or vertically.
Throughout the lesson, children are encouraged to think critically about the data representation by answering key questions. They explore how to determine the number of images to draw and discuss the readability of different pictogram orientations. Completing missing columns or rows in their pictograms helps them practice precision and attention to detail. Additionally, the lesson delves into reasoning and problem-solving exercises. For instance, students are challenged to improve a pictogram's readability by ensuring symbols are non-overlapping, evenly spaced, and of the same size, and to use a key correctly. They also use clues to complete pictograms accurately, fostering their analytical skills and understanding of how pictograms convey information effectively.

