Statistics - Draw pictograms 1-1 - Presentation
Maths Resource Description
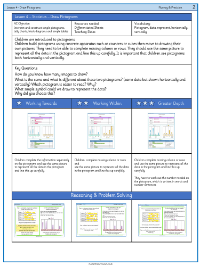
In the educational material provided, students are introduced to the concept of pictograms as a means of representing data visually. They learn how to translate information from a tally chart into a pictogram, where each image represents one unit of data. The lesson prompts students to consider why pictograms are useful for presenting data, encouraging them to discuss the advantages of this visual approach. Through a series of activities, learners are tasked with completing pictograms based on various datasets, such as hair and eye colour, types of pets, and different fruits and vegetables. Each activity is designed to help students understand how to determine the number of images needed to accurately reflect the data, using a key where one image equals one unit.
As the lesson progresses, students are also encouraged to engage in critical thinking by identifying ways to improve existing pictograms. They learn the importance of aligning images neatly and ensuring consistency in size to enhance readability. Furthermore, they are challenged with reasoning tasks that require them to use clues to fill in incomplete pictograms, such as determining the popularity of ice cream flavours. The lesson culminates with independent work where students complete missing parts of pictograms and reflect on how to make them more effective. Discussion questions stimulate deeper understanding by asking students to compare different pictogram layouts, choose appropriate symbols for representation, and justify their choices.

