Statistics - Make tally charts - Planning
Maths Resource Description
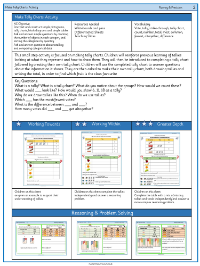
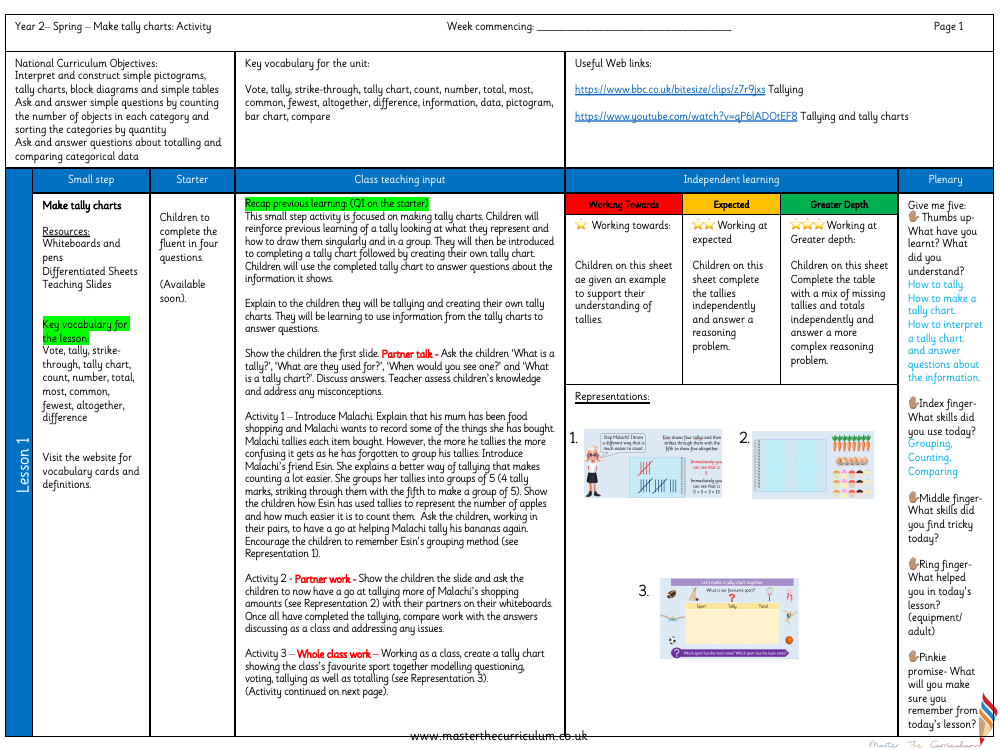
The curriculum for Year 2 students during Spring includes a lesson on creating tally charts, which is an essential skill for interpreting and constructing simple data visualisation tools such as pictograms, block diagrams, and tables. The objective is to enable children to ask and answer questions about categorical data by counting the number of objects in each category and sorting them by quantity. The lesson plan introduces key vocabulary such as 'vote', 'tally', 'tally chart', and 'total', which are crucial for understanding and communicating about data collection and representation. Students are encouraged to use whiteboards, pens, and differentiated sheets to actively participate in the learning process, which involves making tally charts and using them to answer questions about the collected data.
Starting with a recap of what a tally represents and how to draw them, the children are then guided through activities that involve grouping tallies in fives to simplify counting. This is demonstrated through a practical scenario where a character named Malachi needs help with tallying grocery items. By working in pairs and as a whole class, students practice creating and interpreting tally charts, focusing on grouping, counting, and comparing data. The lesson is structured to cater to different levels of understanding, from working towards expected levels to reaching greater depth. The activities are designed to address common misconceptions, such as incorrect tally grouping and miscounting, ensuring that students gain a solid grasp of tally chart creation and interpretation. The 'Give me five' reflection activity at the end of the lesson encourages children to consolidate their learning and identify areas that may need further clarification or practice.

