Statistics Assessment - Worksheet
Maths Resource Description
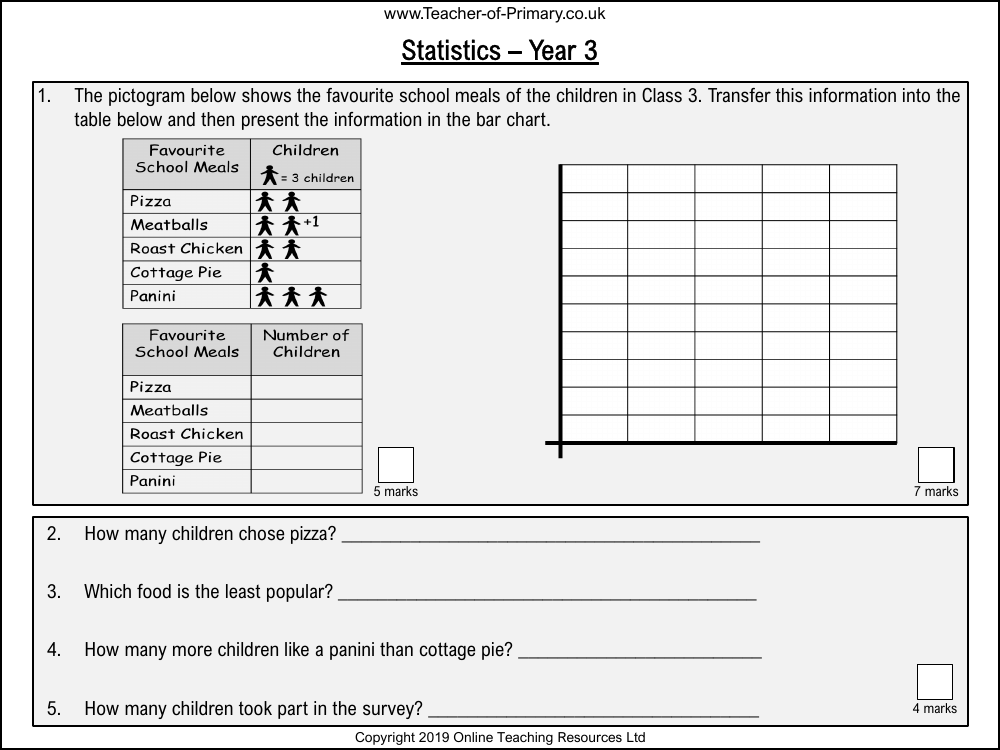
This worksheet from Teacher-of-Primary.co.uk is designed to assess students' understanding of statistics through various tasks involving pictograms, bar charts, and tables. The first task requires students to interpret a pictogram showing Class 3's favourite school meals and then represent this data in both a table and a bar chart. They are asked to identify specific details such as the number of children who chose pizza, the least popular food, and the difference in preference between panini and cottage pie. Additionally, they must calculate the total number of children surveyed.
The second part of the worksheet presents a bar chart detailing the number of hours children spend on activities each week. Students must extract information, such as how many hours Ivy spends on activities, identify the children who engage in 6 hours of activities, and determine who participates in the most hours of activities. They are also encouraged to create and answer their own question based on the bar chart data. Another task involves completing a table and creating a pictogram based on Roland's sorted sweets by colour. Furthermore, students are challenged with a problem-solving question where they must figure out the number of white and purple sweets Roland has, given certain conditions relating to the quantities of sweets in different colours.