Statistics Assessment - PowerPoint
Maths Resource Description
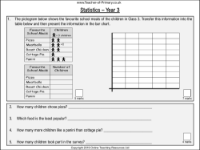
The Statistics Assessment for Year 3 is a comprehensive PowerPoint resource that evaluates students' understanding of data representation and interpretation. The assessment includes a variety of tasks such as transferring information from a pictogram into a table and then using that data to create a bar chart. Students are asked to answer questions about the data, like identifying how many children chose pizza as their favourite meal, which food is the least popular, and the difference in preference between two food items. Additionally, they calculate the total number of children who participated in the survey, further enhancing their analytical skills.
Another section of the assessment presents a bar chart detailing the number of hours children spend on activities each week. Students must interpret the chart to determine specific details, such as the hours spent by an individual child, identify patterns, and compare the activity levels among the children. They are also encouraged to create and answer their own questions based on the bar chart, promoting critical thinking. In another task, pupils complete a table and draw a pictogram based on data about the colour distribution of sweets in a jar. The assessment challenges students to apply mathematical concepts to real-life scenarios, such as adjusting the data when additional sweets are found and determining the new totals for each colour. This engaging resource aids in developing students' statistical literacy and their ability to work with data in various formats.