Tables Statistics - Worksheet
Maths Resource Description
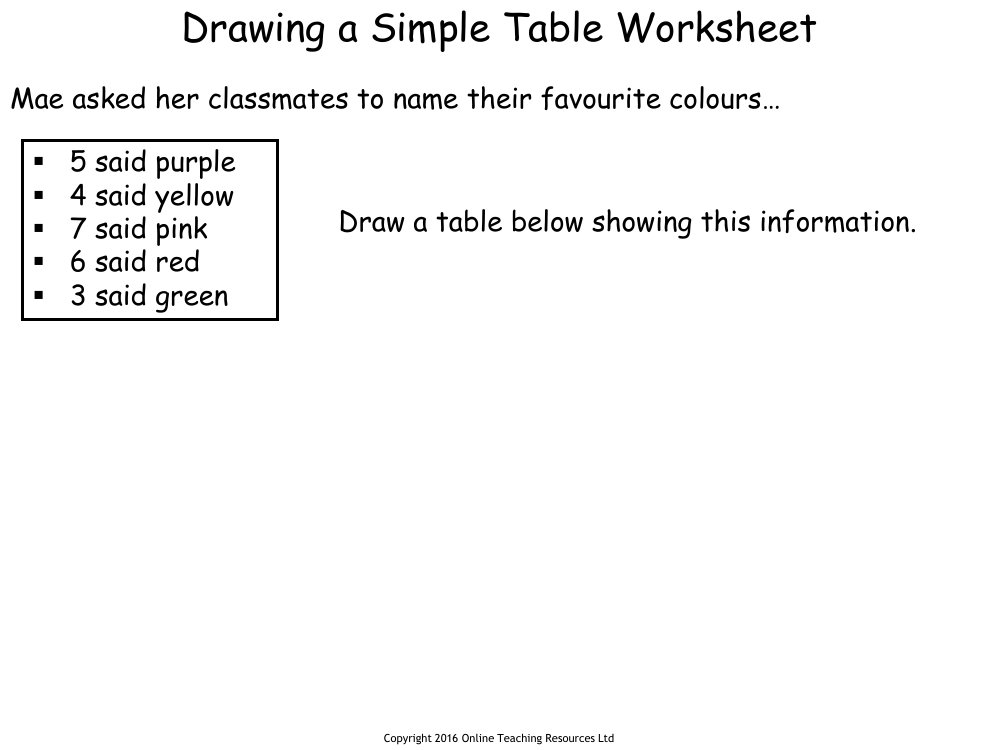
In a worksheet designed for Year 2 students, the concept of recording data in a simple table is introduced through practical examples. The first activity involves a scenario where Mae has surveyed her classmates about their favourite colours. The results are as follows: 5 classmates chose purple, 4 yellow, 7 pink, 6 red, and 3 green. The task for the students is to draw a table to neatly display this information, helping them to understand how data can be organised visually to enhance clarity and comprehension.
The second part of the worksheet presents a pre-filled table detailing the fruits eaten by Omar over the past week. Students are prompted with questions to interpret the data from the table, such as identifying the number of bananas Omar ate, determining which fruit he consumed the most and the least of, and recalling what Omar ate on a specific day of the week. In another exercise, students are asked to organise information about the pets owned by Daisy's friends into a table. This information includes various pets such as dogs, cats, hamsters, and fish, owned by Fazila, Marcus, Mary, and Nicholas. By completing these tasks, students practice the essential skill of data representation and enhance their ability to analyse and draw conclusions from tabulated information.