Tables Statistics - PowerPoint
Maths Resource Description
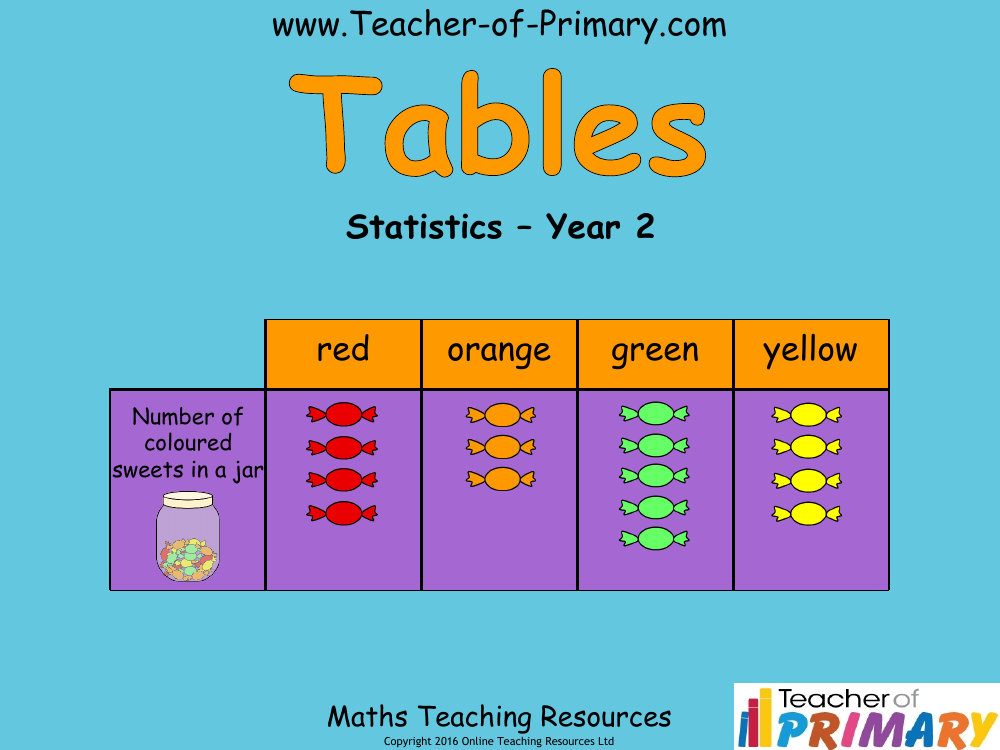
In this educational resource designed for Year 2 pupils, the focus is on learning to create and interpret simple tables within the context of statistics. The lesson begins by introducing tables as a method to record information efficiently. The students are shown a table that categorises the number of different coloured sweets in a jar, using rows and columns to organise the data. The columns represent the various colours—red, orange, green, and yellow—while a single row indicates the quantity of each coloured sweet. This visual representation of data is a fundamental skill in understanding how to log and interpret information.
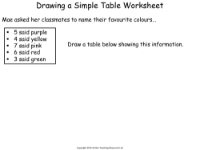
Following the introduction, the pupils are encouraged to apply their new knowledge by answering questions based on the information presented in the table. They identify which colour of sweet is least and most abundant in the jar and calculate the total number of sweets. The resource further challenges the students to create their own table using data about their classmates' favourite colours. Through this interactive approach, children learn to draw a table and answer questions such as identifying the most and least popular colours and counting the number of classmates who prefer a specific colour. This hands-on activity not only reinforces their ability to organise information but also helps them to draw conclusions from the data presented in a simple table format.