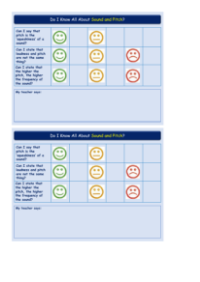
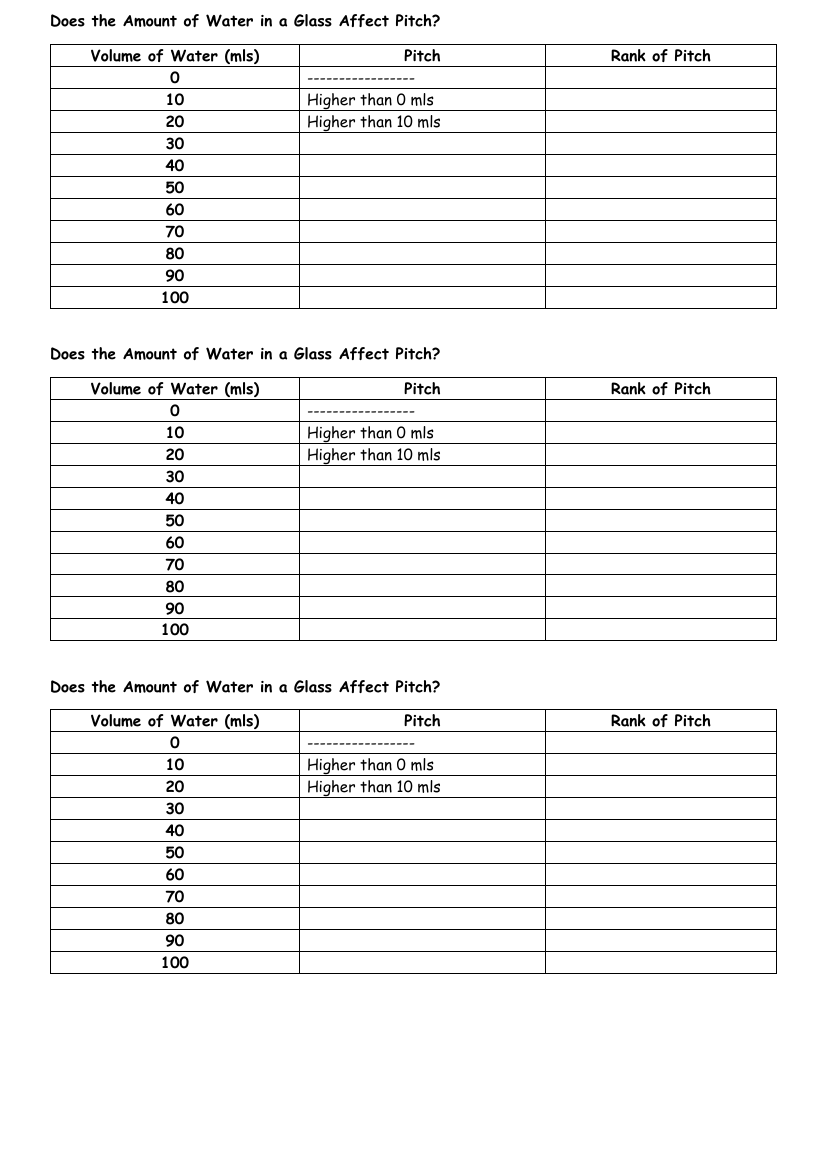
Sound and Pitch - Results Tables
Science Resource Description
Exploring the fascinating relationship between the volume of water in a glass and the pitch of the sound produced, students can engage in an interactive experiment. The investigation is structured around a results table that records the volume of water in millilitres (mls) alongside the corresponding pitch and its rank when compared to other volumes. Initially, the glass is empty, serving as the baseline for the experiment. As water is added in increments of 10ml, observations are made to determine whether the pitch of the sound changes. The early results indicate that a glass with 10ml of water produces a higher pitch than an empty glass, and adding another 10ml to make it 20ml results in a pitch that is higher still than that of the 10ml volume.
The experiment continues with the same method, adding water in 10ml increments up to 100ml, each time listening and ranking the pitch produced when the glass is struck. The rank of pitch column is designed to compare the pitch with the previous volume, creating a clear and organised way to document the changes in pitch as the volume of water increases. The pattern observed from the initial measurements sets the expectation that as more water is added, the pitch will continue to change. This practical investigation not only provides a hands-on learning experience but also encourages students to understand the scientific principles of sound and pitch in a clear and engaging manner.