Bar charts with deliberate errors
Maths Resource Description
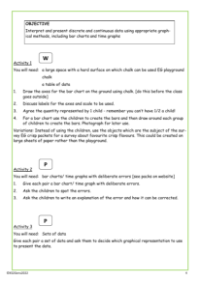
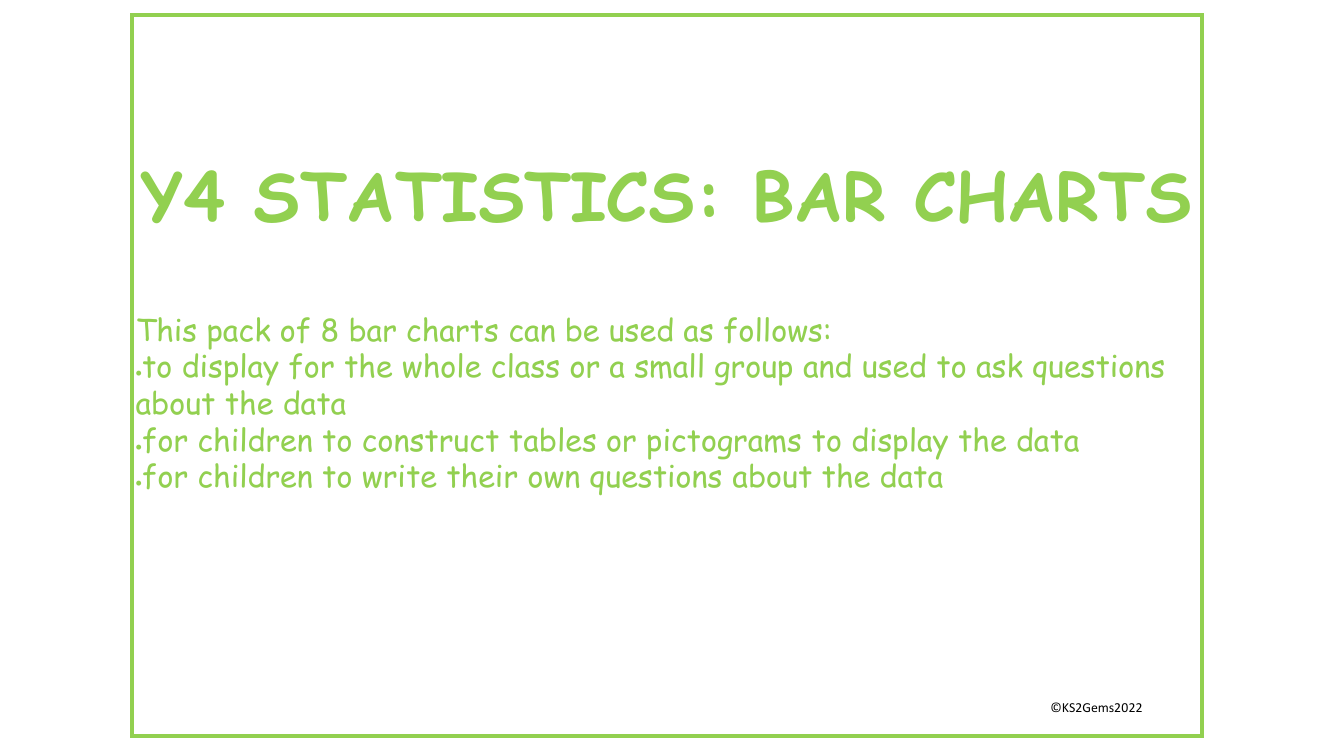
The KS2Gems2022 collection offers an engaging set of eight bar charts tailored for Year 4 students learning statistics. These charts are designed with deliberate errors to encourage critical thinking and analysis. Teachers can use them in various ways, such as displaying them to the whole class or a small group to prompt discussions about the data presented. Students are encouraged to engage with the data by constructing their own tables or pictograms, and by formulating questions based on the information depicted in the charts. This hands-on approach not only reinforces their understanding of bar charts but also enhances their ability to interpret and question data critically.
The bar charts cover a range of topics that are relatable and interesting to Year 3 students, including favourite ice cream and crisp flavours, preferred pizza toppings, top chocolate bars, holiday destinations, and the school's favourite colours. Each chart presents data in a visual format, with varying quantities represented by bars of different heights. For example, the ice cream flavour chart lists flavours such as vanilla, mint, and strawberry, with corresponding numbers indicating their popularity. Similarly, the chart on favourite holiday destinations includes places like Portugal, Mexico, and Spain. There's even a bar chart showing the school's favourite colours with numerical values, and another depicting the temperature variations over a week. These resources are designed to make learning about data handling both enjoyable and educational for young students.