Vocabulary - Statistics
Maths Resource Description
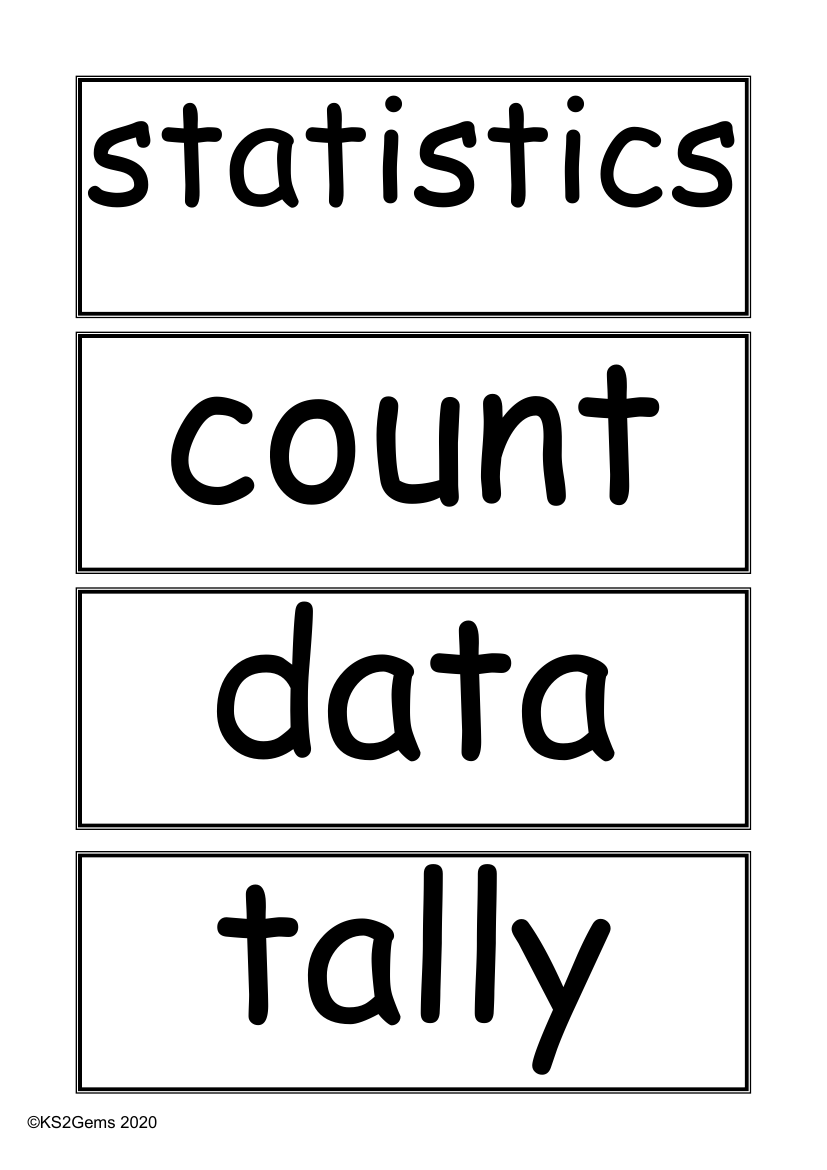
When delving into the world of statistics, a variety of vocabulary is essential for understanding and communicating data effectively. Terms such as 'statistics', 'count', 'data', and 'tally' form the foundation of this mathematical field. These words are used to describe the collection and initial processing of numerical information. For instance, 'tally' refers to a simple counting method often used to record and organise data. The copyright symbol followed by 'KS2Gems 2020' indicates that these terms are likely part of educational material provided by KS2Gems for that year.
Further vocabulary in the realm of statistics includes words like 'sort', 'graph', 'block graph', and 'pictogram'. These are related to the visual representation of data, allowing for easier interpretation and comparison. A 'block graph' is a type of chart that uses blocks to visually show quantities, while a 'pictogram' uses symbols or pictures to represent data. Other terms such as 'represent', 'group', 'set', and 'list' are associated with the organisation of data into categories for analysis. Advanced statistical vocabulary includes 'frequency', 'frequency table', 'Carroll diagram', and 'Venn diagram', each referring to different methods of displaying and analysing data. A 'frequency table', for example, shows how often each value occurs. Lastly, terms like 'label', 'title', 'axis', 'axes', and 'scale' are related to the components of a graph or chart, which are crucial for providing context and understanding the dimensions of the data presented.

