Statistics - Two way Tables - Presentation
Maths Resource Description
Lesson 8 of the statistics series introduces students to two-way tables, a method of organising data that involves two sets of information. These tables are useful tools for comparing and analysing data across two categories. For example, a two-way table might display the number of male and female staff members in various job roles at Liverpool police station. Students are encouraged to discuss potential uses for two-way tables, such as tracking the handedness of students in a year group or recording the number of staff in different positions. The lesson aims to teach students how to interpret and fill in two-way tables, calculate totals for rows and columns, and use the tables to answer questions about the data presented.
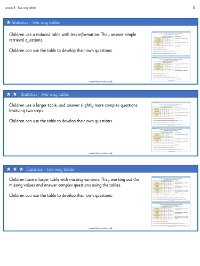
Students engage in activities that require them to calculate totals and answer questions using the data from two-way tables. For instance, they might determine the number of female inspectors at a police station or the number of left-handed children in a year group. They are also tasked with completing tables with missing information, such as the results of football matches for teams like Manchester United, Liverpool, and Chelsea, or the ownership of pets among children. The lesson encourages critical thinking by asking students to compare numbers, like the difference between male left-handed students and female right-handed students. The activities are designed to help students become proficient in using two-way tables for organising and analysing data, and they conclude with discussions on how to find the needed information and the creation of their own two-way tables using class data.

