Tables - PowerPoint
Maths Resource Description
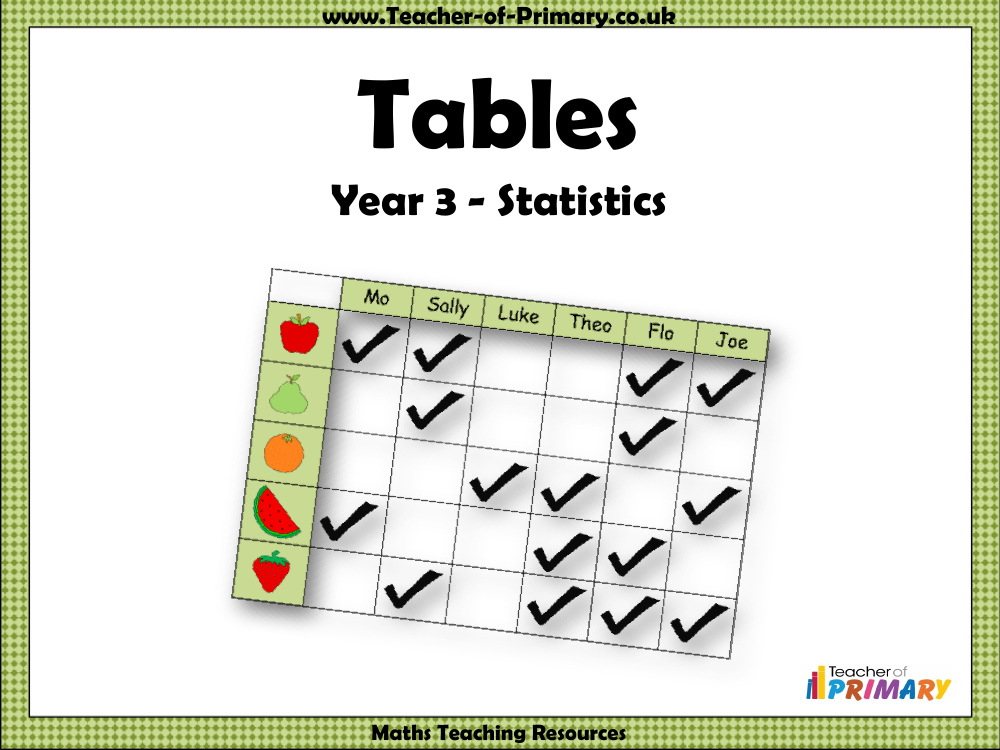
In a series of educational resources aimed at Year 3 students, the concept of using tables for presenting and interpreting data in statistics is introduced. A table is defined as a tool that organises information in a way that makes it easier to read and understand. For instance, a table can display which fruits are preferred by different children, allowing readers to quickly ascertain each child's fruit preferences. This visual representation of data is key to helping students grasp the concept of tables and how they can be used to summarise and compare information efficiently.
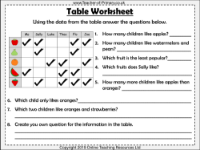
The teaching materials include various exercises that encourage students to engage with data presented in tables. In one activity, children are asked to determine the number of students who like certain fruits, identify the least popular fruit, and ascertain individual preferences such as which fruits Sally enjoys. Another worksheet focuses on real-life applications, such as analysing the increase in drink prices at a café. Students practice calculating the difference in cost for items like fruit juice and identify which drinks saw the largest price hike. These activities are designed to not only enhance mathematical skills but also to foster critical thinking by asking students to create their own questions based on the data provided in the tables.