Pictograms - PowerPoint
Maths Resource Description
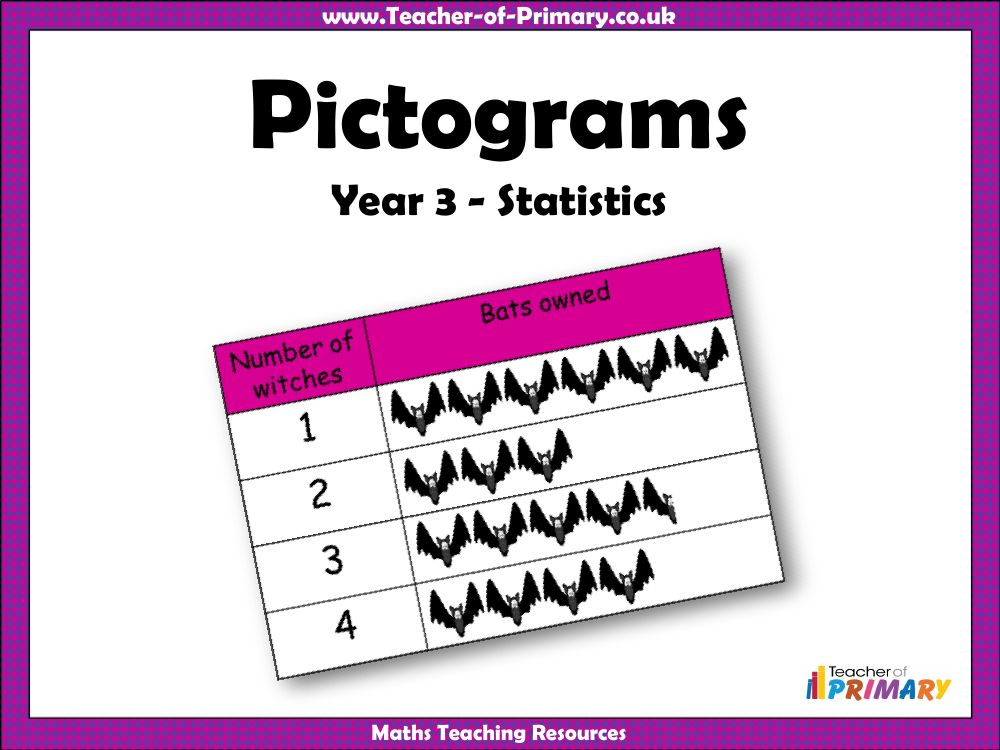
Pictograms are visual tools used in mathematics to represent data through the use of images or symbols. In a set of teaching resources for Year 3 students, the concept of pictograms is introduced with clear examples. A pictogram is presented, showing the number of bats owned by a group of witches, with a key indicating the value of each pictorial representation. For instance, one picture equals four bats, and a half picture equals two bats, providing a straightforward way to interpret the data. Students are then encouraged to use this information to answer questions, such as determining how many witches own a certain number of bats, or which witch owns the most or least number of bats.
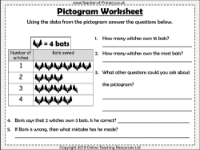
The teaching resources also include worksheets where students can apply their understanding of pictograms to different scenarios. One activity involves completing a pictogram based on the number of oranges picked by different classes, with specific conditions like one class picking twice as many as another. After completing the pictogram, students answer questions about the data, such as comparing the quantities picked by different classes, calculating the total number of oranges picked, and identifying potential errors in interpretation. Through these exercises, students learn to analyse and draw conclusions from pictorial data, enhancing their statistical skills and attention to detail.