Max Maths, Year 2, Work Book, Making pictograms (2)
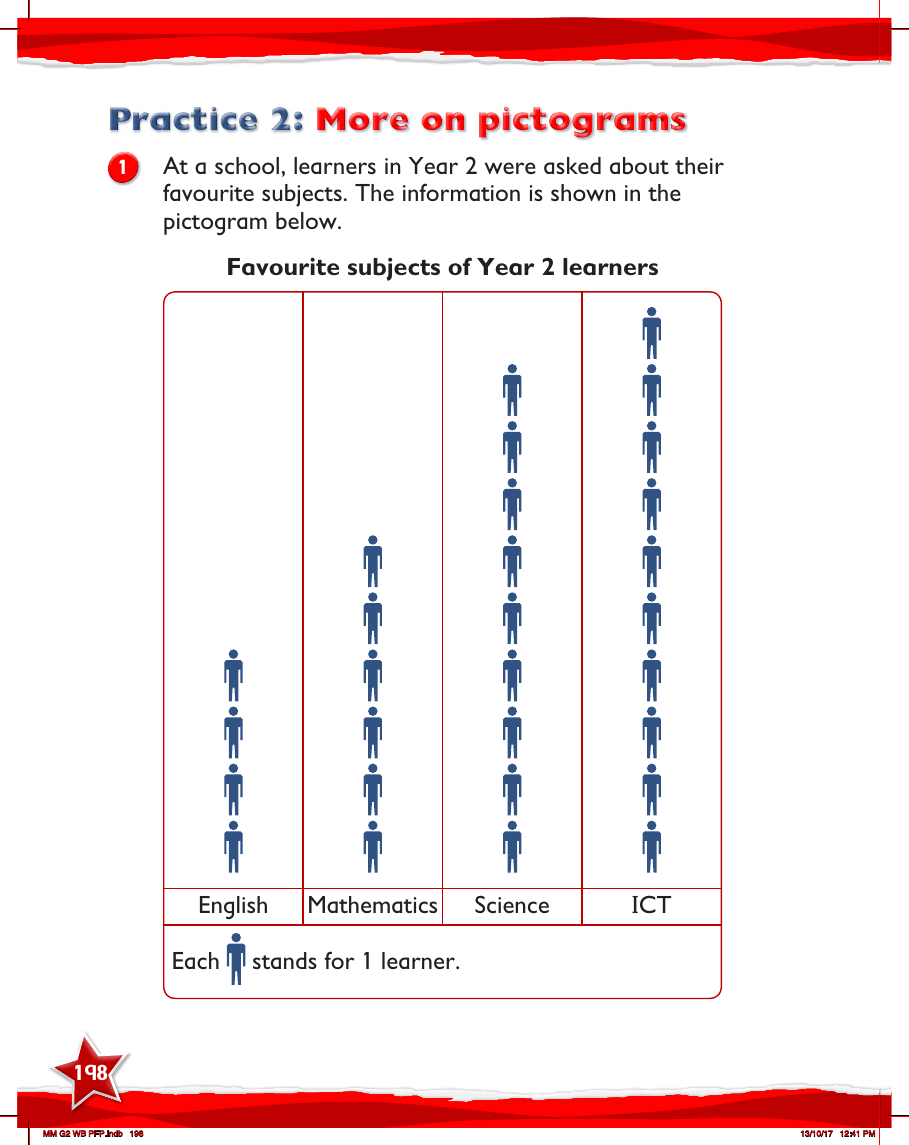

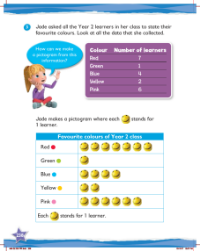
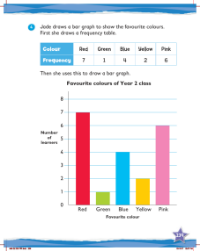
In the Max Maths Year 2 Workbook, students are given the opportunity to practice interpreting and creating pictograms, a key skill in understanding and presenting data visually. One of the exercises presents a pictogram depicting the favourite subjects of Year 2 learners, with symbols representing individual students' preferences. Children are tasked with identifying the most and least popular subjects, counting the number of learners who favour each subject, and performing simple calculations to compare the popularity of different subjects. This exercise not only reinforces their counting skills but also introduces them to basic data analysis.
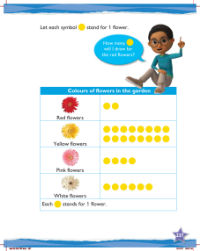
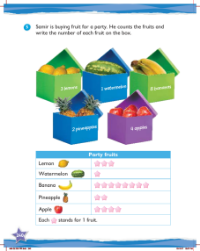
Another activity involves counting the colours of cars in a supermarket car park. Each symbol on the pictogram corresponds to one car, and students must count the number of cars for each colour, compare quantities, and draw conclusions about which colours are most and least common. Additional exercises in the workbook include analysing the number of dishes sold at a restaurant and converting numerical data about items in an electronics shop into pictograms. These tasks help students to grasp the concept of frequency and to represent quantitative information graphically, laying the foundation for more advanced data handling skills in the future.