Interpreting Pie Charts
Maths Resource Description
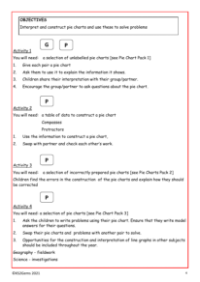
The "Y6 Pie Chart Pack 3" is an educational resource designed to enhance the data interpretation skills of Year 6 students. This pack is comprised of a collection of pie charts, each serving as a visual tool to represent data in a circular format. The teacher's instructions suggest a collaborative approach to learning, where children are encouraged to work in pairs. One of the engaging activities involves giving each pair a pie chart, which they will use to devise their own data-based questions for another pair to answer. This task not only requires the children to interpret the pie chart but also to organise the information into a data table and come up with a fitting title for their work.
To ensure a clear understanding of the task, it is recommended that the teacher demonstrates the process with the whole class before the students begin. This modelling helps to clarify how questions can be formed and answered using the pie chart. The activity aims to promote critical thinking and to deepen the students' comprehension of how pie charts can be used to represent and analyse data. By creating and answering each other's questions, the children learn to appreciate the practical application of pie charts in real-world scenarios. This interactive method of learning is intended to make the process of understanding pie charts both educational and enjoyable.
