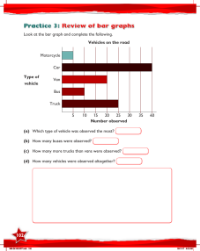
Max Maths, Year 6, Learn together, Review of pictograms, block graphs, bar graphs and line graphs (6)
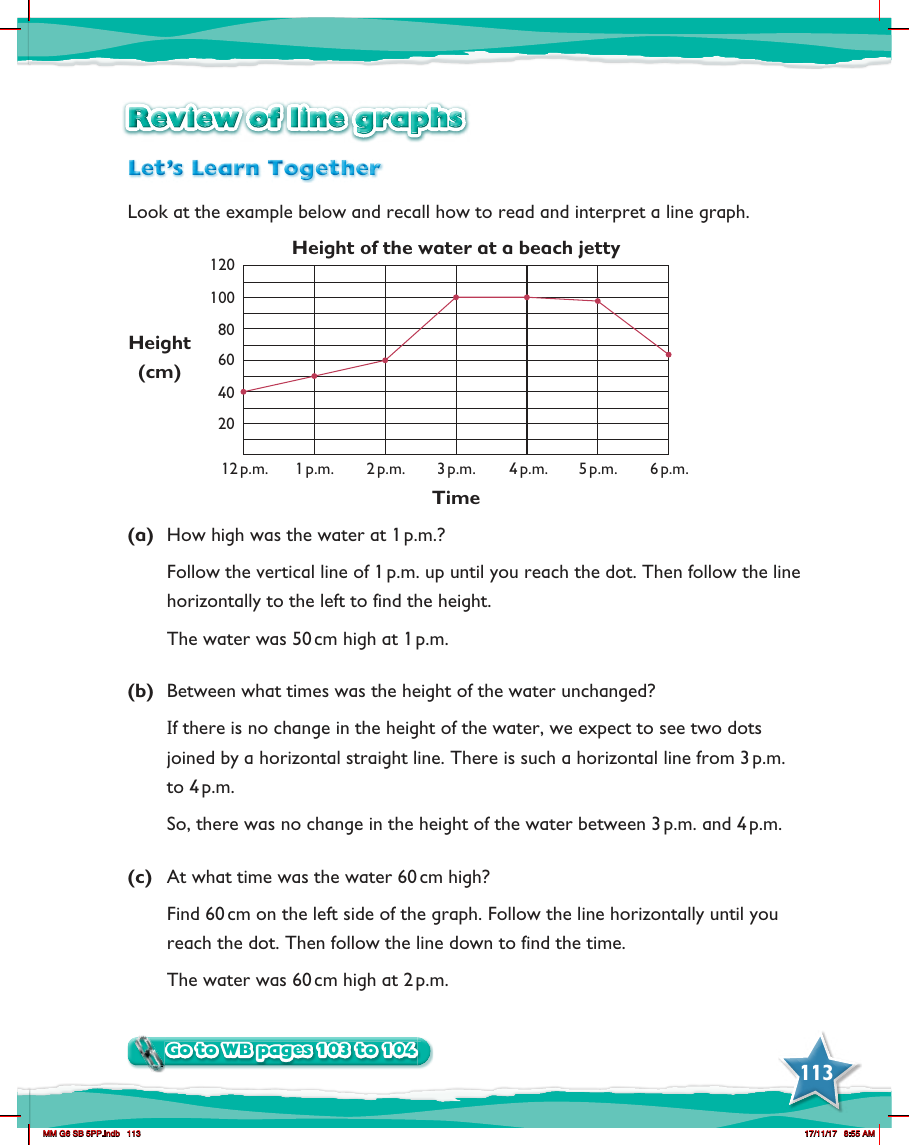

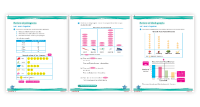
In a Year 6 mathematics session, students are revising how to read and interpret line graphs through an illustrative example that measures the height of water at a beach jetty over time. The graph presents data on the vertical axis indicating the height of water in centimetres, ranging from 20 cm to 120 cm, and the horizontal axis represents time, from 12 p.m. to 6 p.m. To determine the water's height at 1 p.m., students are instructed to trace the vertical line at the 1 p.m. mark upwards until it intersects with the graphed line, and then horizontally across to read the height, which in this case is 50 cm.
Students are also tasked with identifying periods when the water level remained constant. This is represented by a horizontal line on the graph, indicating no change in height over time. Upon examining the graph, it is observed that from 3 p.m. to 4 p.m., there is a horizontal line, signifying that the water height did not change during that hour. Additionally, to find out when the water was 60 cm high, students look for the 60 cm mark on the vertical axis and follow the horizontal line across to where it meets the graphed line, then trace downwards to the time, which reveals that the water reached 60 cm at 2 p.m. This exercise in graph interpretation is further supported by workbook activities on pages 103 to 104, where students can continue to practice these skills.