Max Maths, Year 6, Work Book, Review of pictograms, block graphs, bar graphs and line graphs (1)
Maths Resource Description
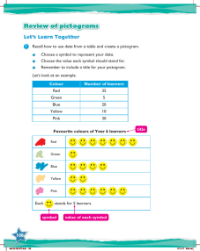
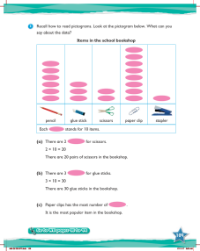
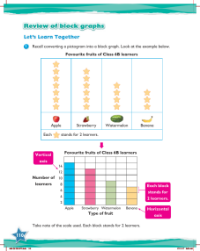
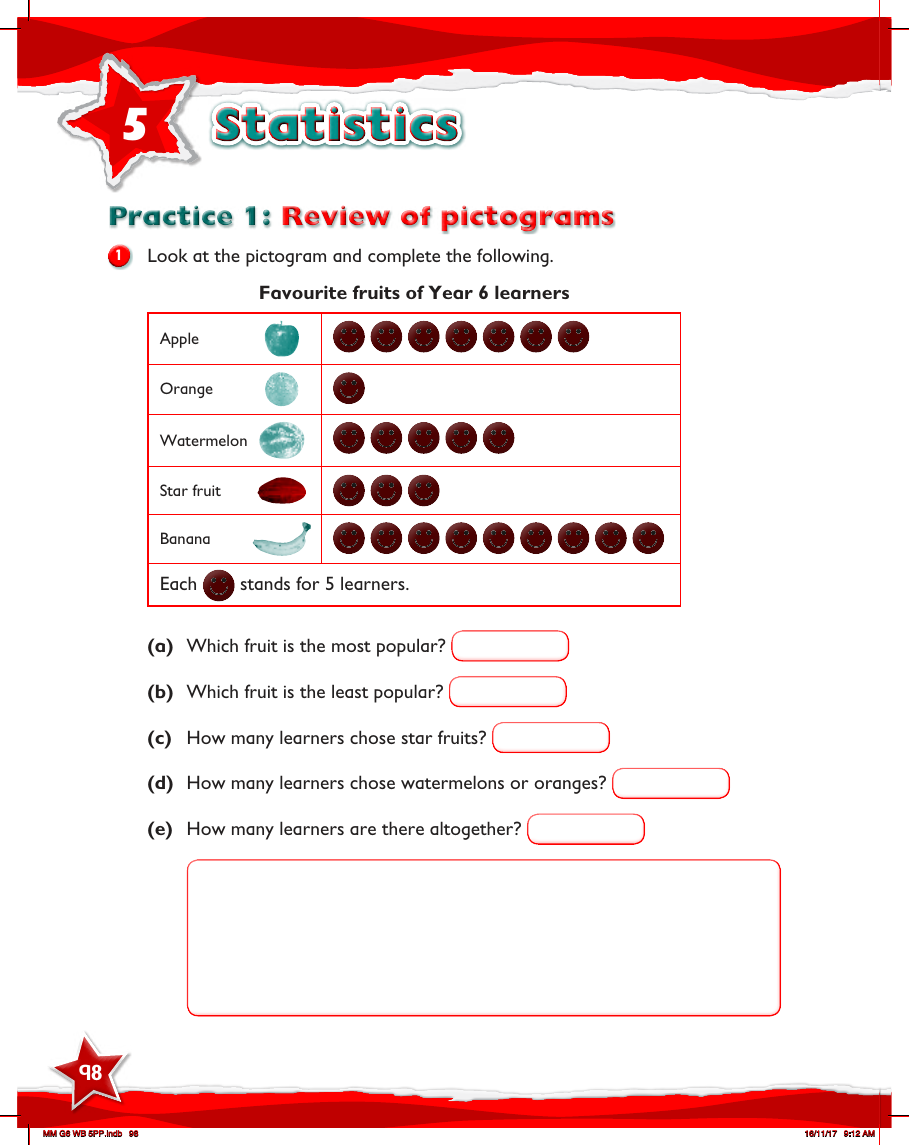
In the Max Maths Year 6 Workbook, students are given the opportunity to review their understanding of various types of graphs through a series of practice questions. The first practice focuses on pictograms, a visual representation where symbols or images stand in for a certain number of items or individuals. In this particular exercise, students are asked to interpret a pictogram that displays the favourite fruits of Year 6 learners, with each symbol representing 5 learners. They must determine which fruit is the most and least popular among the students, calculate the exact number of learners who prefer star fruits and watermelons or oranges, and finally, tally the total number of learners represented in the pictogram.
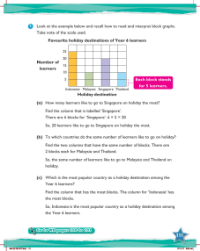
The second practice continues with the theme of pictograms, this time presenting the favourite colours of people at a shopping mall, where each symbol equates to 10 people. Students are tasked with identifying the most popular colour and quantifying the number of individuals who favour yellow. Additionally, they must combine the totals for those who chose black or red, determine how many people selected blue, and calculate the number of individuals who did not pick blue as their favourite colour. These exercises aim to enhance students' ability to interpret and analyse data presented in a pictogram format.
