Max Maths, Year 6, Learn together, Review of pictograms, block graphs, bar graphs and line graphs (4)
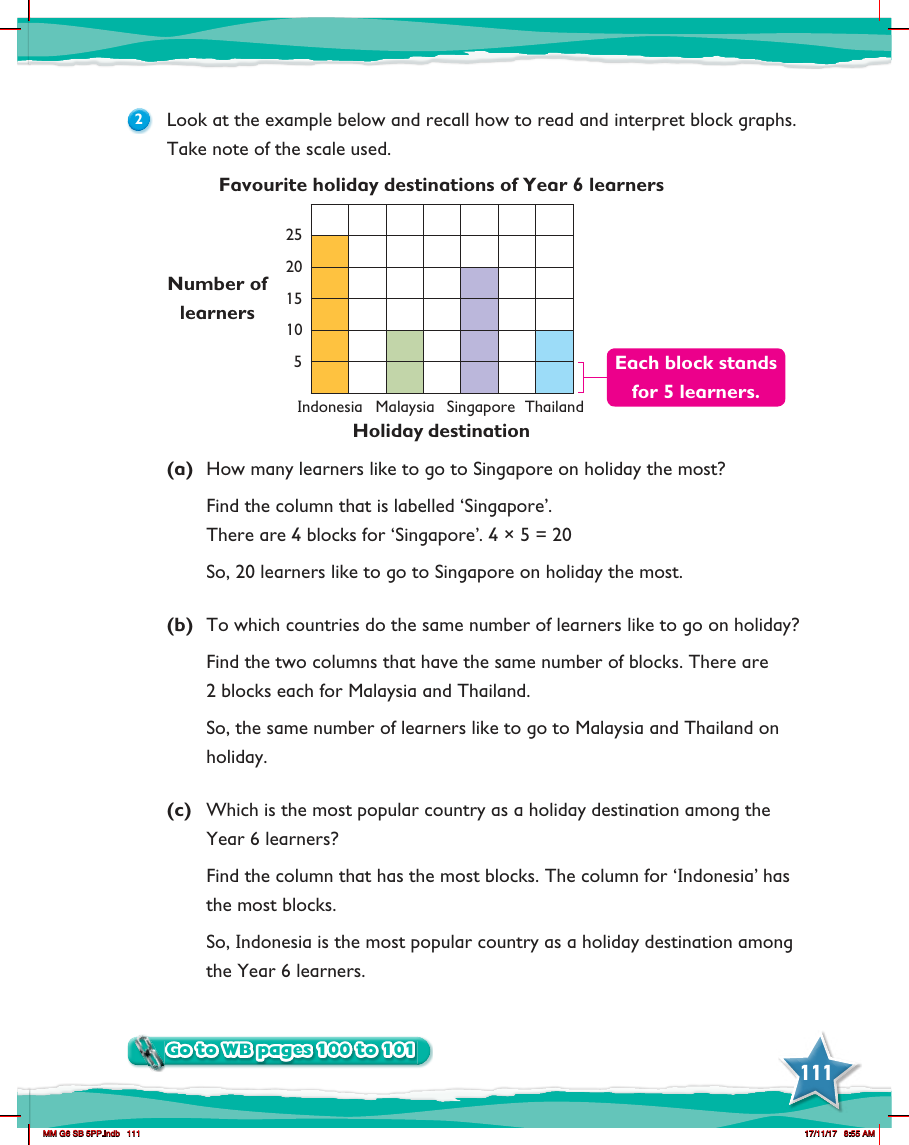

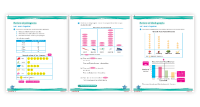
In a Year 6 maths lesson, students are revisiting the concept of interpreting data from block graphs. The example provided illustrates the favourite holiday destinations of Year 6 learners, with each block representing 5 learners. The graph lists destinations such as Malaysia, Singapore, Thailand, and Indonesia, with varying numbers of blocks indicating the popularity of each destination. Students are asked to analyse the graph to answer questions about the data presented.
For instance, to determine the number of learners who prefer Singapore as their holiday destination, students must identify the column labelled 'Singapore' and count the blocks. With 4 blocks present, and each block representing 5 learners, it can be calculated that 20 learners favour Singapore for their holiday. Similarly, by finding columns with an equal number of blocks, students can identify that Malaysia and Thailand are equally preferred by the same number of learners. Finally, by observing which column has the most blocks, it is deduced that Indonesia is the most popular holiday destination among the Year 6 learners. The lesson encourages students to engage with the provided workbook to further practice these skills.