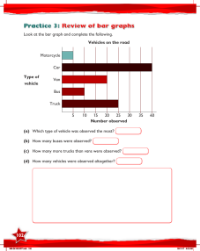
Max Maths, Year 6, Learn together, Review of pictograms, block graphs, bar graphs and line graphs (2)
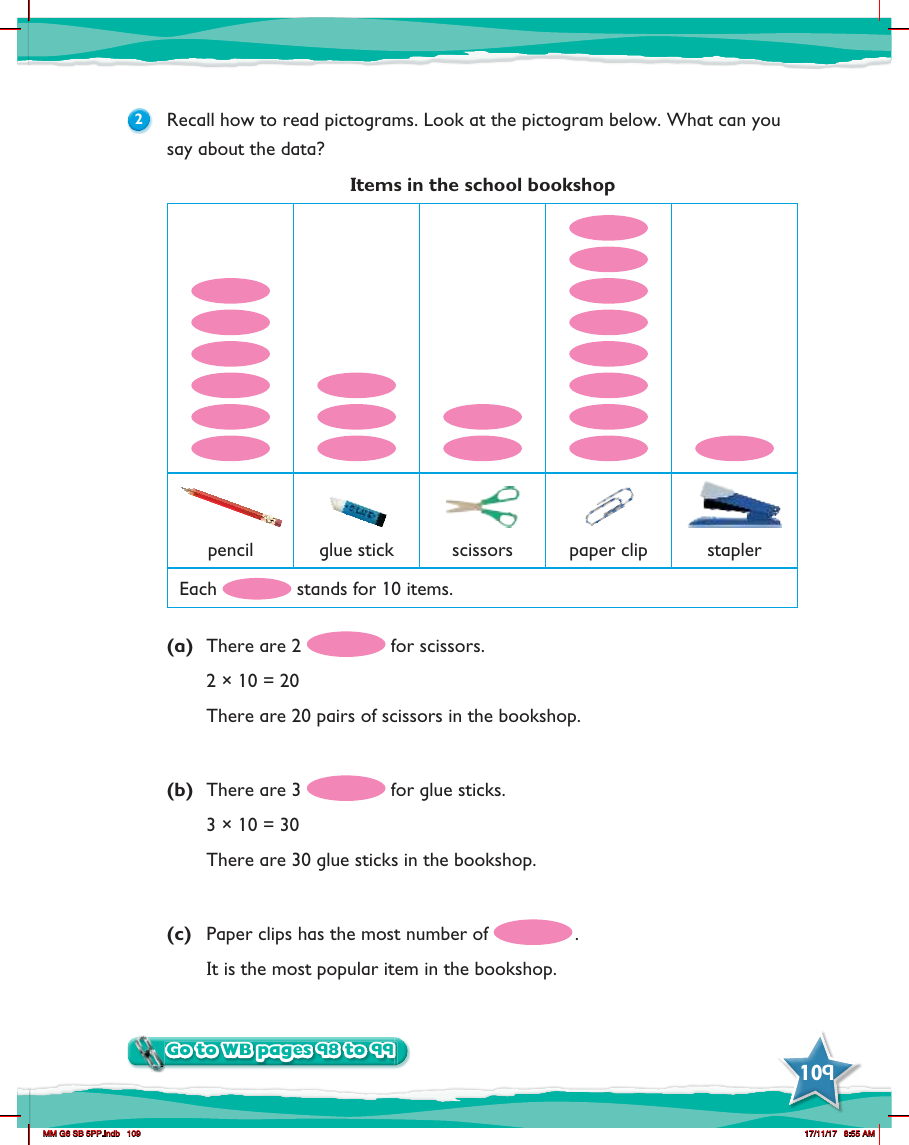

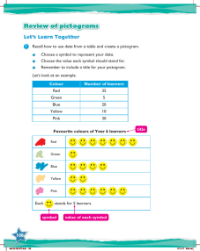
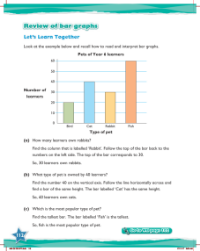
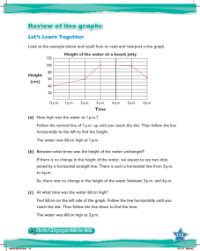
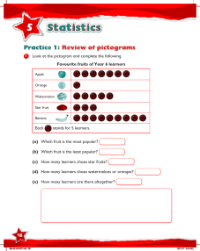
Max Maths Year 6 provides a comprehensive review of different types of graphs, including pictograms, which are a visual way to represent data. In a pictogram, symbols are used to represent a certain number of items. For instance, in a given example, each symbol corresponds to 10 items found within a school bookshop. By interpreting the pictogram, students can easily determine the quantity of each item in stock. For example, the pictogram indicates that there are 20 pairs of scissors represented by 2 symbols, each symbol equating to 10 pairs. Similarly, glue sticks are shown with 3 symbols, totalling 30 glue sticks available in the bookshop.
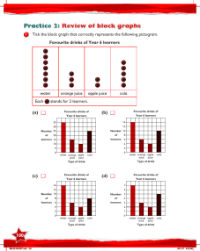
Further analysis of the pictogram reveals that paper clips have the highest symbol count, indicating they are the most popular or most stocked item in the bookshop. This exercise helps students to recall how to read and interpret pictograms accurately, a skill that is essential for understanding and presenting data. For more practice and in-depth learning, students are directed to workbook pages 98 to 99, where they can engage with additional exercises to reinforce their understanding of reading and interpreting various graph types such as block graphs, bar graphs, and line graphs.