Max Maths, Year 4, Try it, Carroll diagrams (1)

Maths Resource Description
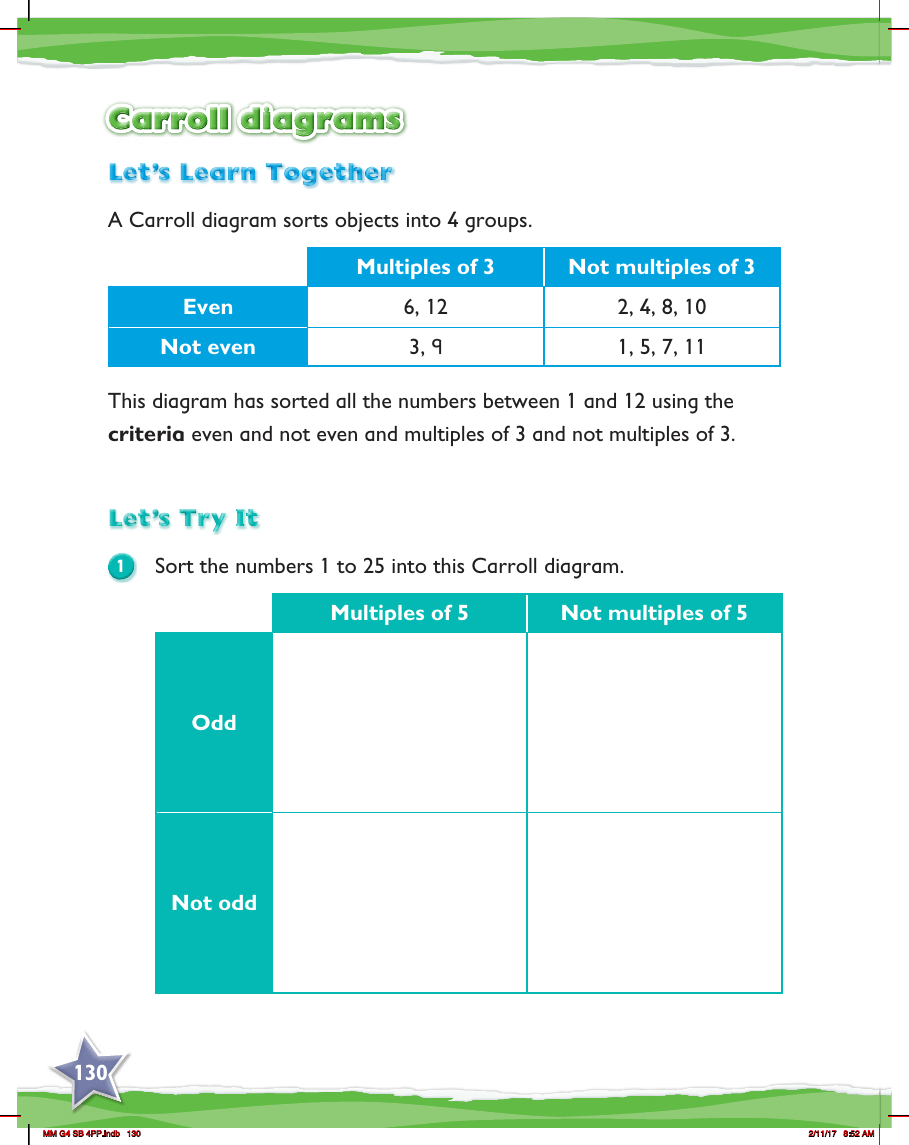
In the "Max Maths, Year 4" curriculum, students are introduced to Carroll diagrams as a way to categorise numbers based on different criteria. A Carroll diagram is a simple grid that helps to sort objects or numbers into four groups. The example provided in the lesson features a Carroll diagram that divides numbers from 1 to 12 into categories based on two criteria: whether they are even or not even, and whether they are multiples of 3 or not multiples of 3. The numbers are then placed in the appropriate sections of the diagram, with even multiples of 3 like 6 and 12 in one section, and not even and not multiples of 3 like 1, 5, 7, and 11 in another.
The interactive part of the lesson, titled "Let's Try It," challenges students to apply their understanding of Carroll diagrams by sorting the numbers from 1 to 25. The criteria given for this task are slightly different from the example: students must determine whether the numbers are odd or not odd (even), and whether they are multiples of 5 or not multiples of 5. This activity encourages students to practice their knowledge of multiplication and number properties while engaging in a fun sorting exercise. It's a practical way to enhance their analytical and numerical skills, as they must consider two attributes simultaneously to correctly place each number in the diagram.