Statistics - Draw pie charts - Worksheet
Maths Resource Description
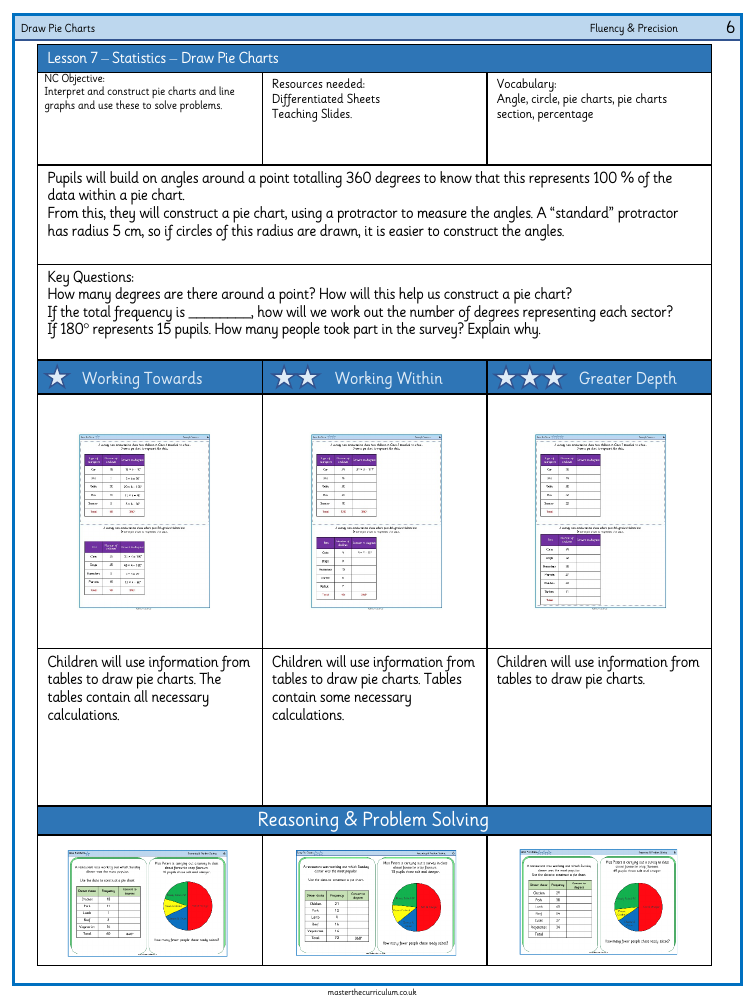
In Lesson 7 of the 'Statistics - Draw Pie Charts' series, students are tasked with interpreting and constructing pie charts, as well as using line graphs to solve problems. This lesson focuses on the National Curriculum objective of working with statistical representations, specifically pie charts. To begin, pupils will need access to differentiated worksheets and teaching slides, which will provide them with the necessary data and guidance for the lesson. The key vocabulary for this lesson includes terms such as 'angle', 'circle', 'pie charts', 'percentage', and 'pie chart section'. The concept that the total angles around a point in a circle sum up to 360 degrees, representing 100% of the data, is fundamental to constructing pie charts.
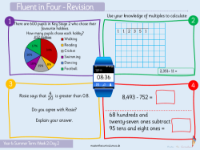
Using this knowledge, students will use a protractor to measure and draw the angles on a pie chart, where each section represents a portion of the data. For example, if a survey shows that 15 children travel to school by car, this is converted to degrees by multiplying by a specific factor (e.g., 15 x 6 = 90°) to represent the corresponding sector in the pie chart. The lesson includes a series of questions to enhance understanding, such as calculating the number of degrees per data sector and determining the total number of survey participants based on the degrees representing a subset. Furthermore, the lesson provides opportunities for reasoning and problem-solving, where students might use given data to construct pie charts and solve additional questions related to the data presented.
