Statistics - Draw pie charts - Starter
Maths Resource Description
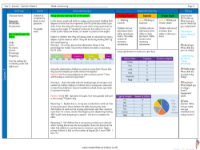
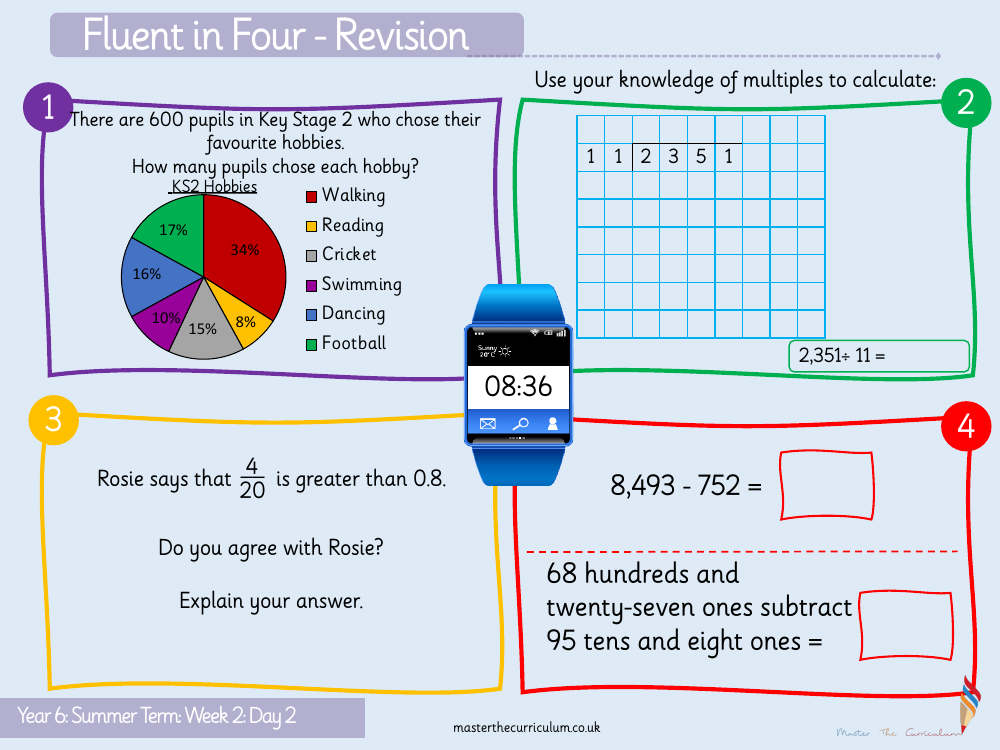
In a mathematics lesson for Year 6 during the Summer Term, students tackle a variety of numerical and statistical challenges. The day begins with a 'Fluent in Four' revision session, where pupils are asked to perform calculations such as subtracting 95 tens and eight ones from 68 hundreds and twenty-seven ones. They are also presented with a pie chart representing the favourite hobbies of 600 Key Stage 2 pupils, with percentages indicating preferences for activities like walking, reading, cricket, swimming, dancing, and football. The students are tasked to work out the actual number of pupils who chose each hobby, applying their understanding of percentages.
The lesson continues with exercises that require the students to use their knowledge of multiples, such as dividing 2,351 by 11, which results in 213 with a remainder of 8. Additionally, there is a critical thinking component where Rosie suggests that a certain fraction is greater than 0.8, and students must determine the accuracy of her statement and explain their reasoning. The answer reveals that Rosie's claim is incorrect, as the fraction in question is actually equivalent to 0.2. These activities are designed to sharpen the pupils' arithmetic skills and enhance their ability to interpret data, while also encouraging them to engage in problem-solving and logical reasoning.
