Day Length - Results Tables
Science Resource Description
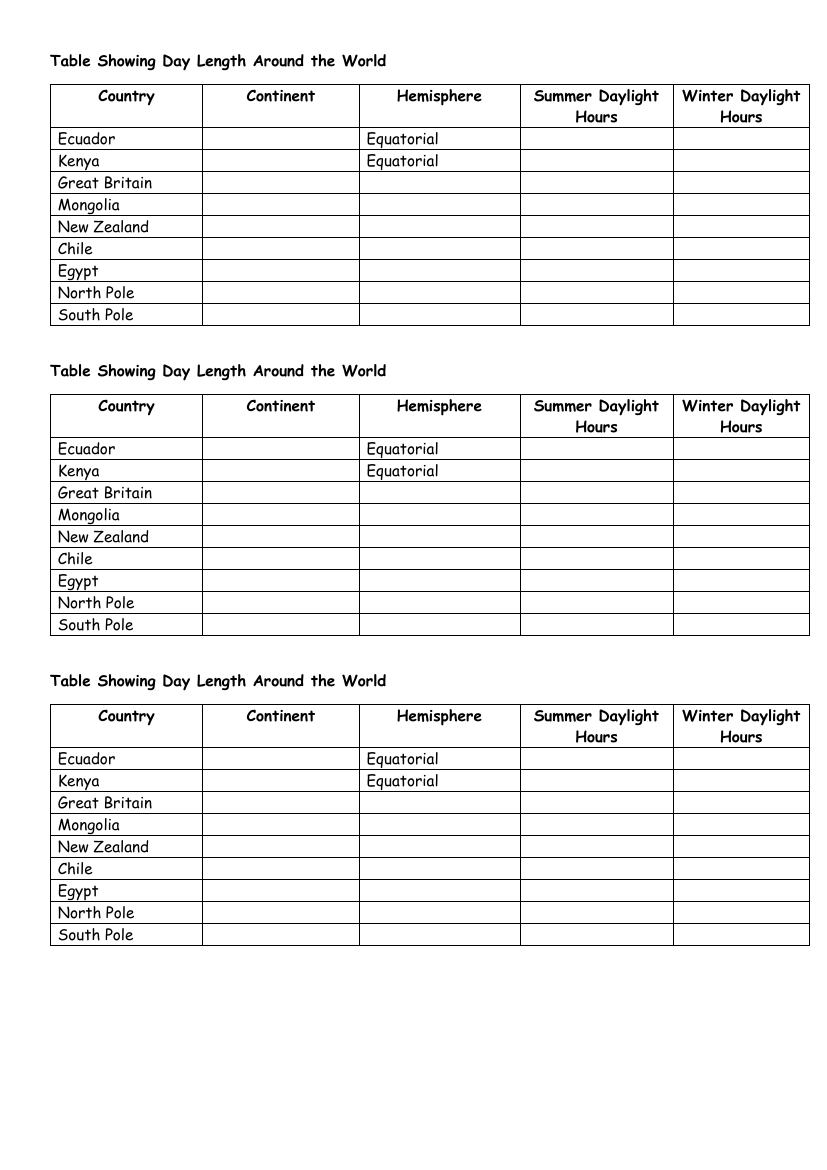
The first series of tables provides a comparative view of day length in various countries around the world, categorised by country, continent, and hemisphere. The tables are designed to display the number of daylight hours experienced during the summer and winter seasons for each location. Countries situated along the equator, such as Ecuador and Kenya, are included, as well as nations from different continents like Great Britain in Europe, Mongolia in Asia, New Zealand in Oceania, Chile in South America, and Egypt in Africa. Additionally, the tables feature the extreme cases of the North Pole and the South Pole, which are known for their unique daylight patterns due to their geographical positions at the Earth's extremes.
Following this, another set of tables explores the effect of the amount of light on temperature. These tables are structured to show the relationship between time, measured in seconds, and the corresponding temperature in degrees Celsius. The data points are intended to represent the change in temperature over time as light exposure varies. In a similar vein, the last set of tables examines the effect of changing the amount of sand on the time it takes for an hourglass to empty. The tables outline different quantities of sand—ranging from a quarter to a full amount—and the time, again in seconds, it takes for the sand to pass from one bulb to the other. These tables are likely to demonstrate the direct correlation between the volume of sand and the duration of time measured.