Max Maths, Year 3, Learn together, Block graphs (3)
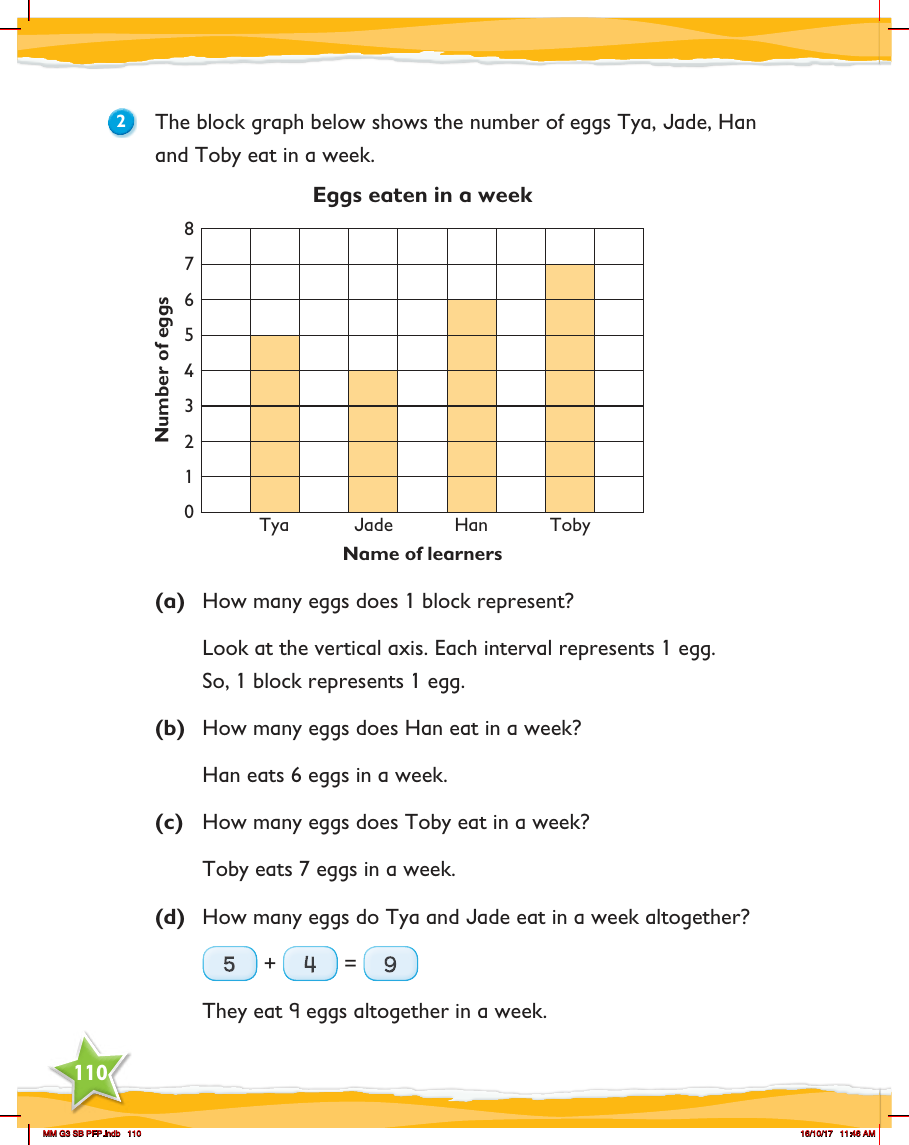

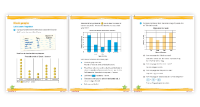
In the 'Max Maths, Year 3, Learn together' series, the lesson on block graphs provides an engaging way for children to understand data representation. The provided block graph illustrates the weekly egg consumption of four individuals: Tya, Jade, Han, and Toby. Each block on the graph equates to one egg, as indicated by the intervals on the vertical axis. This visual representation allows students to easily interpret and compare the number of eggs each person eats over the course of a week.
By analysing the graph, students can answer questions about the data presented. For instance, they can determine that Han consumes 6 eggs in a week by counting the blocks aligned with his name. Similarly, Toby's egg intake is represented by 7 blocks, indicating he eats 7 eggs weekly. To calculate the combined total of eggs eaten by Tya and Jade, students simply add the number of blocks corresponding to each of their names, resulting in a total of 9 eggs consumed between the two in a week. These exercises not only help students practice their counting and addition skills but also aid in their understanding of how to interpret data from a block graph.