Max Maths, Year 3, Learn together, Block graphs (1)
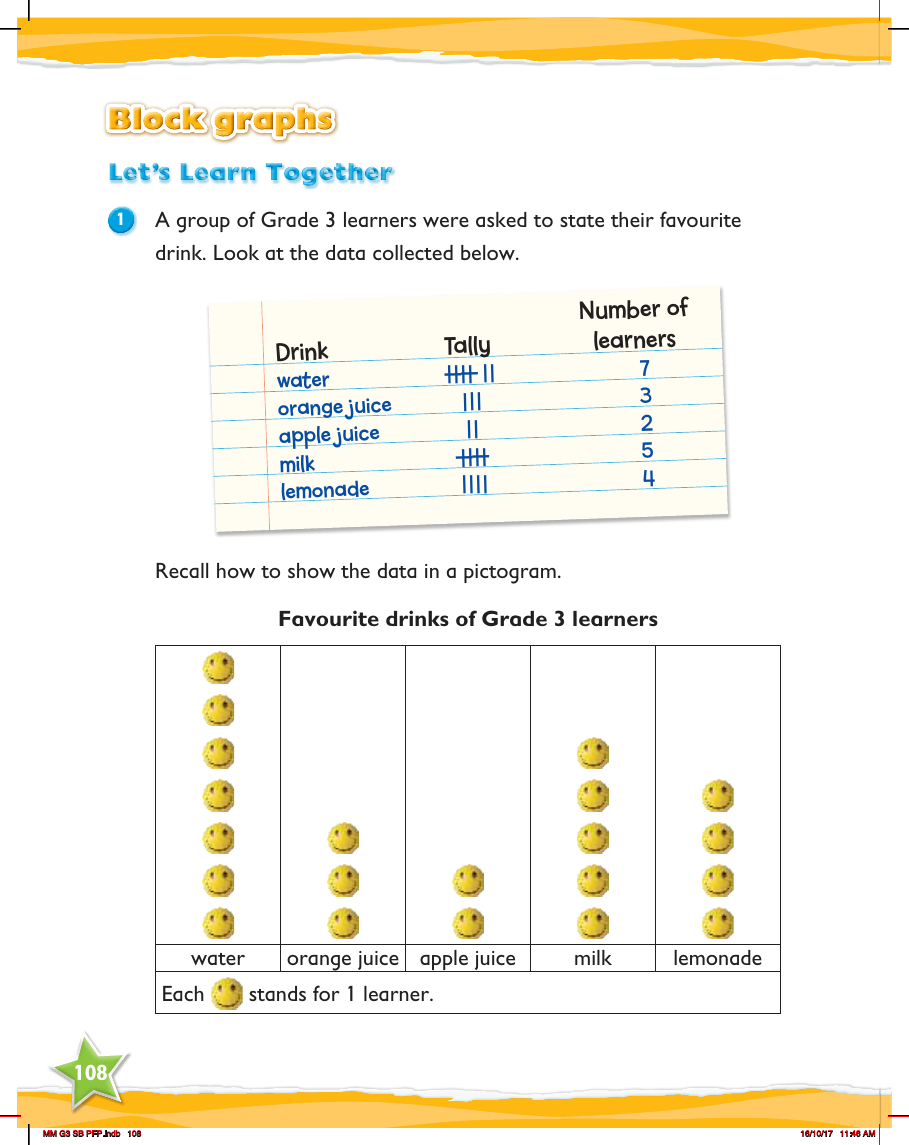

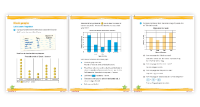
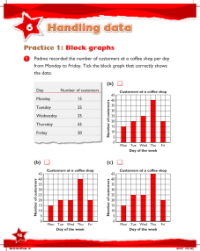
In a Year 3 mathematics lesson, students are introduced to the concept of block graphs as a way to visually represent data. The lesson begins with a practical example where Grade 3 learners were surveyed about their favourite drinks. The data collected is presented in a tally chart, showing the number of students who prefer water, orange juice, apple juice, milk, and lemonade. The tally marks are grouped in sets of five to make counting easier, with each vertical line representing one student and every fifth entry shown as a diagonal line crossing four vertical ones.
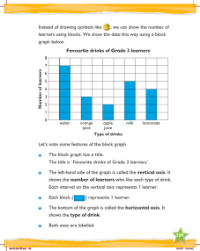
The lesson then transitions to demonstrating how this data can be transformed into a block graph, also known as a pictogram. In this visual representation, each block corresponds to one learner's response. The block graph is labelled with the different drink options along the horizontal axis, and the number of learners is represented on the vertical axis. By converting the tallies into blocks, students can easily compare the popularity of each drink option at a glance. This engaging activity not only helps children understand how to organise and interpret data but also reinforces counting and comparison skills.