Max Maths, Year 2, Learn together, Venn diagrams and Carroll diagrams (2)
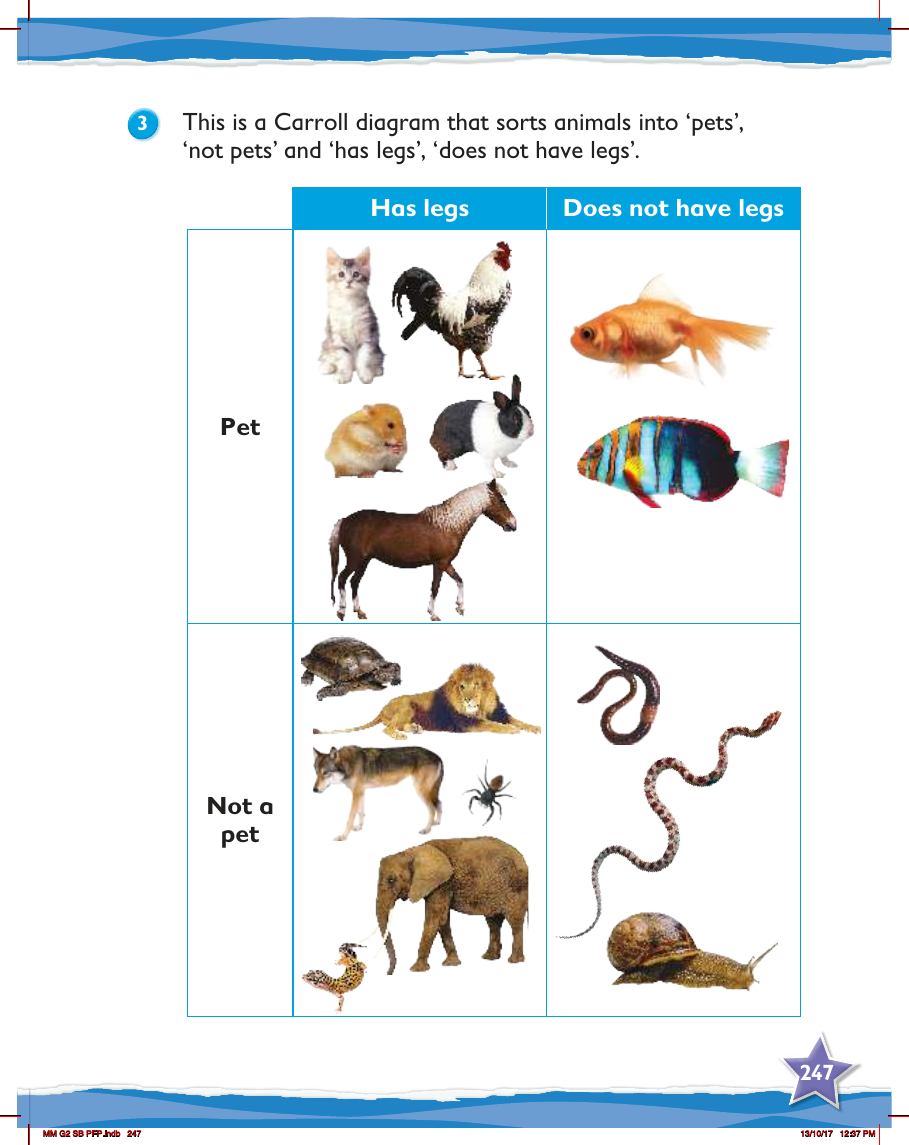

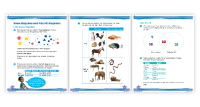
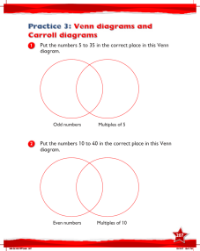
In the Year 2 Max Maths curriculum, students are introduced to the concept of sorting data using Carroll diagrams. A Carroll diagram is a simple grid that helps children to classify items according to two different attributes. In this particular lesson, the children learn to sort animals based on whether they are considered pets or not, and whether they have legs or not. The diagram is divided into four sections, with one axis categorizing animals by the presence of legs and the other axis by their status as a pet or not a pet. This visual representation aids in developing logical thinking and categorization skills in young learners.
The Carroll diagram presented in the lesson provides a clear and interactive way for children to engage with the sorting process. For example, an animal that is commonly kept as a pet and has legs, such as a dog, would be placed in the section labeled 'Has legs' and under 'Pet'. Conversely, an animal that is not typically a pet and lacks legs, like a fish, would be placed in the 'Does not have legs' and 'Not a pet' section. Through this activity, students practice distinguishing characteristics of animals and learn to organize information in a structured way, which is a fundamental skill in both mathematics and daily life.