Max Maths, Year 2, Try it, Venn diagrams and Carroll diagrams (1)

Maths Resource Description
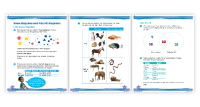
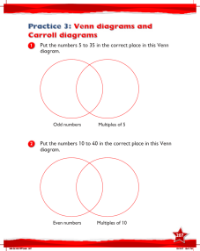
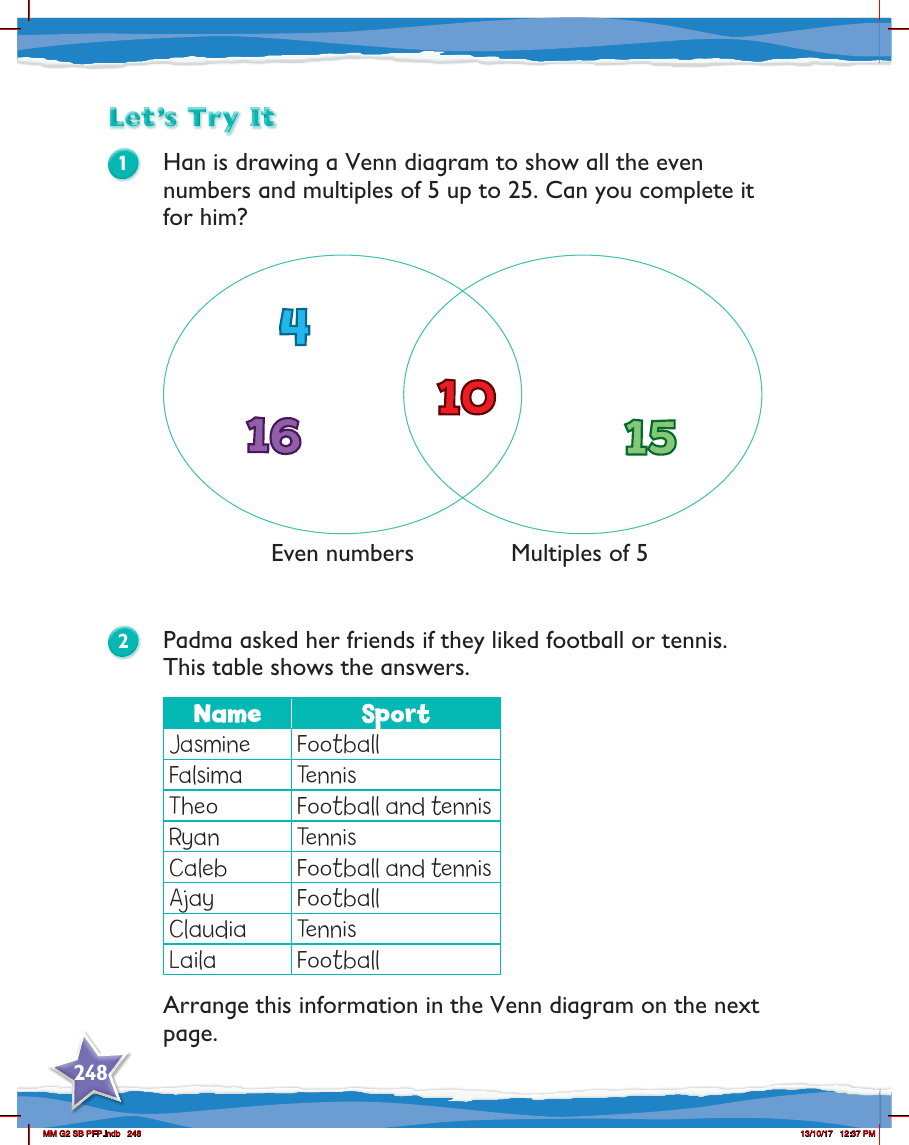
In an engaging activity designed for Year 2 pupils, they are introduced to the concept of Venn diagrams, a visual tool used to categorise and display the relationship between two sets of items. The first task presents a scenario where Han is creating a Venn diagram to represent even numbers and multiples of 5 up to the number 25. Students are invited to help Han by placing the numbers 16, 15, 10, and 4 into the correct sections of the diagram. The even numbers and multiples of 5 are to be separated into two overlapping circles, where the intersection will include numbers that are both even and multiples of 5.
The second task involves a real-life application of Venn diagrams where students are asked to sort information based on the preferences of Padma's friends for two sports: football or tennis. The pupils are given a table with names and the corresponding sport each friend likes. The task is to arrange the names into a Venn diagram on the following page, showing those who like football, those who like tennis, and those who enjoy both sports. This exercise helps to reinforce the understanding of how Venn diagrams can be used to visually organise data into distinct categories with some possible overlaps.