Statistics - Pie charts with percentages - Worksheet
Maths Resource Description
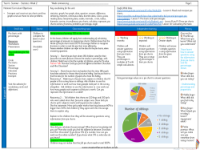
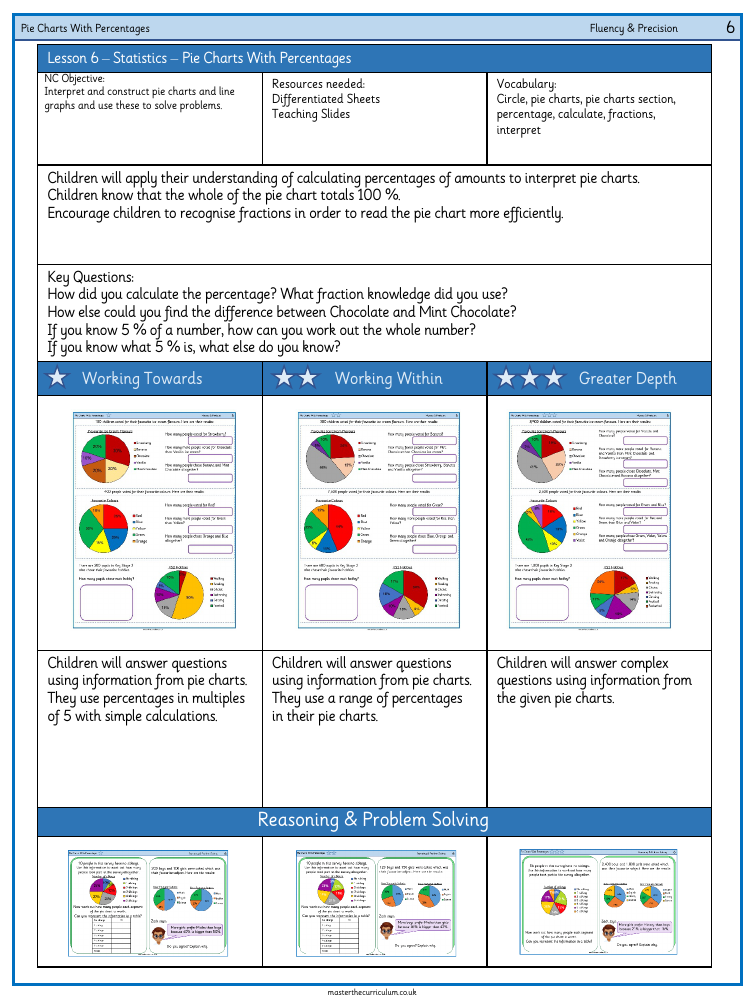
Master the Curriculum offers a comprehensive worksheet on Statistics, specifically focusing on pie charts with percentages. The lesson targets Year 6 pupils and aligns with the National Curriculum objective of interpreting and constructing pie charts and line graphs to solve problems. To facilitate learning, the worksheet provides differentiated sheets and teaching slides. The vocabulary for this lesson includes terms like 'circle', 'pie charts', 'pie charts section', 'percentage', 'calculate', 'fractions', and 'interpret'. Pupils will utilise their knowledge of calculating percentages from amounts to interpret various pie charts, understanding that a full pie chart represents 100%. This concept is reinforced through activities where children are encouraged to use their understanding of fractions to read pie charts more efficiently. Questions such as "How did you calculate the percentage?" and "How else could you find the difference between Chocolate and Mint Chocolate?" prompt pupils to apply their skills in real-world scenarios.
The worksheet is divided into sections for fluency and precision, reasoning, and problem-solving. It includes practical exercises where students answer questions based on the information presented in the pie charts. The exercises start with simple calculations using percentages in multiples of 5 and progress to more complex questions involving a range of percentages. For example, pupils may be asked how many people voted for a particular ice cream flavour or to compare the number of votes between two flavours. Additionally, the worksheet presents scenarios such as determining the number of pupils who chose each hobby from a pie chart, or whether more girls prefer Maths than boys, based on the percentage information provided. These activities are designed to deepen the pupils' understanding of pie charts and percentages, while also honing their problem-solving skills.