Statistics - Pie charts with percentages - Planning
Maths Resource Description
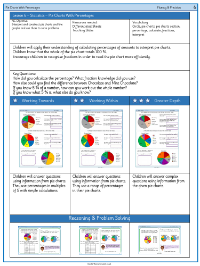
The Year 6 summer term lesson on 'Pie charts with percentages' is crafted to enhance students' ability to interpret and construct pie charts, as well as solve related problems. The National Curriculum objectives are clear: students must learn to read and create both pie charts and line graphs. The lesson aims to deepen their understanding of key statistical vocabulary such as 'percentage', 'calculate', 'fractions', and 'interpret', among others. To facilitate learning, the lesson includes resources like worksheets and a presentation, and students are encouraged to visit a specific website for vocabulary cards and definitions. The lesson begins with a review of previous learning and then moves on to activities where children apply their knowledge of percentages to interpret pie charts, with a focus on recognising fractions for efficient reading of the charts and referring to the data to answer questions.
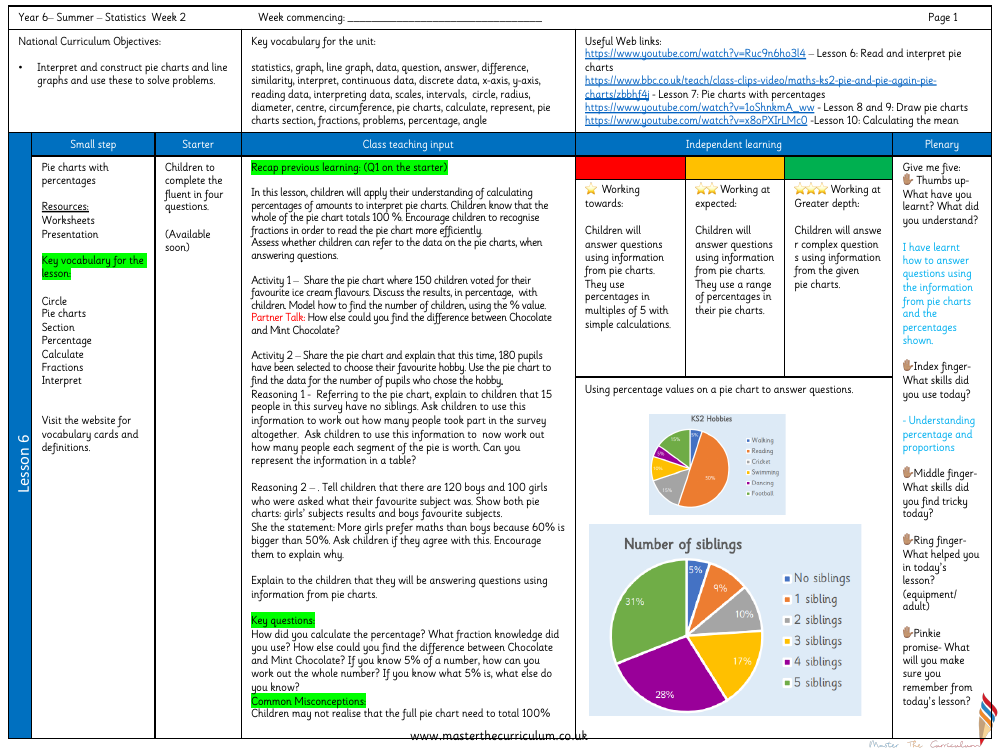
During the class, students engage in a variety of activities designed to solidify their understanding of pie charts and percentages. They discuss the results of a pie chart showing children's favourite ice cream flavours and calculate the number of children corresponding to each percentage. They also work with different datasets, such as the hobbies of 180 pupils, using the pie chart to find specific data. The lesson includes reasoning tasks that challenge students to deduce the total number of survey participants from a given segment and to critically analyse statements about data represented in pie charts. Reflection on the lesson allows students to recognise what they have learned, the skills they've used and found challenging, and what they promise to remember. The lesson is structured to cater to different levels of understanding, from working towards basic questions to tackling complex queries at greater depth, all centred around the use of percentages in pie charts.