Statistics - Pie charts with percentages - Presentation
Maths Resource Description
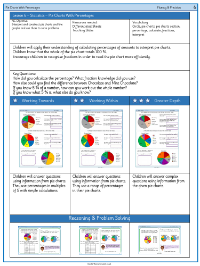
In a series of educational slides, students are invited to deepen their comprehension of percentages through the interpretation of pie charts. The slides begin by prompting learners to reflect on what the term 'percent' means and how to calculate percentages. This sets the stage for the first activity, where 150 children have voted for their favourite ice cream flavours, and the results are displayed in a pie chart. Students are tasked with determining the number of votes for specific flavours like Vanilla, as well as comparing the votes for Chocolate against Mint Chocolate. They are also challenged to calculate the combined votes for Chocolate, Banana, and Vanilla. The purpose of these questions is to encourage the application of percentage knowledge to real-world data representation.
Moving on to the second activity, the slides present a pie chart where 180 Key Stage 2 pupils have chosen their favourite hobbies, with each hobby represented by a different percentage. Students must figure out the exact number of pupils for each hobby, translating percentages into whole numbers. Another reasoning task involves a survey about the number of siblings, where learners use the given percentage and the number of people with no siblings to deduce the total number of survey participants. A subsequent slide presents a comparative scenario where boys and girls have different preferences for school subjects, and students are asked to evaluate a statement about these preferences using percentage calculations. The slides conclude with independent work, encouraging learners to represent pie chart data in a table and to use their understanding of fractions and percentages to solve problems and justify their reasoning.