Statistics - Read and interpret pie charts - Worksheet
Maths Resource Description
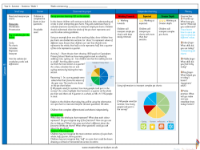
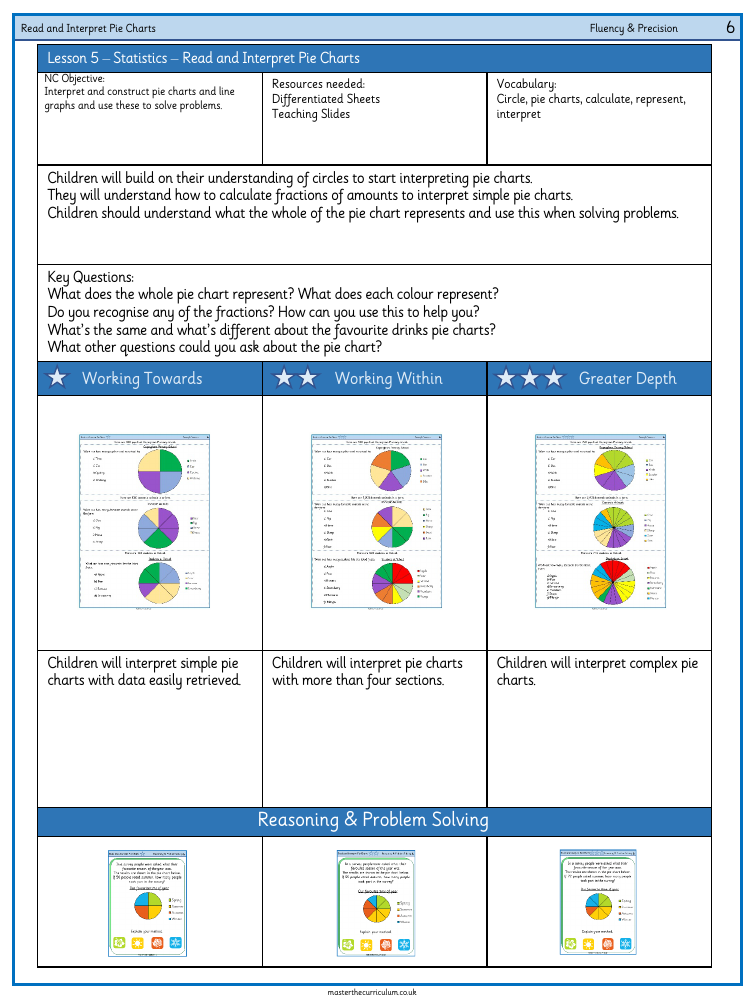
The educational resource from masterthecurriculum.co.uk provides a comprehensive set of activities to help Year 6 students master the skill of reading and interpreting pie charts. The curriculum-aligned objective is for the children to learn how to construct and interpret pie charts and line graphs to solve problems. The lesson requires differentiated sheets and teaching slides, and it introduces students to relevant vocabulary such as 'circle', 'pie charts', 'calculate', 'represent', and 'interpret'. The initial focus is on building an understanding of circles, which lays the foundation for interpreting pie charts. Students will learn to calculate fractions of amounts and apply this knowledge to understand what each segment of the pie chart represents, using this information to solve various problems.
Key questions are posed to encourage critical thinking, such as identifying what the whole pie chart and each colour represent, recognising fractions, and understanding the similarities and differences between pie charts. Students will start with simple pie charts where data is easily retrievable and progress to more complex charts with multiple sections. The tasks involve practical examples, such as determining how many pupils travel to school by various modes of transport, the number of domestic animals on a farm, and students' favourite fruits, with varying totals to challenge different levels of understanding. The resource also includes reasoning and problem-solving activities, where students might be asked to work out the total number of survey participants based on the number of votes for a season, explaining their method. This step-by-step approach helps students to develop fluency and precision in interpreting data visually represented in pie charts.
