Statistics - Read and interpret pie charts - Planning
Maths Resource Description
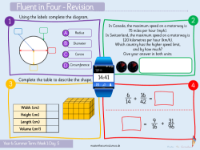
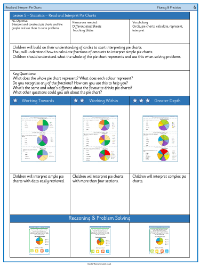
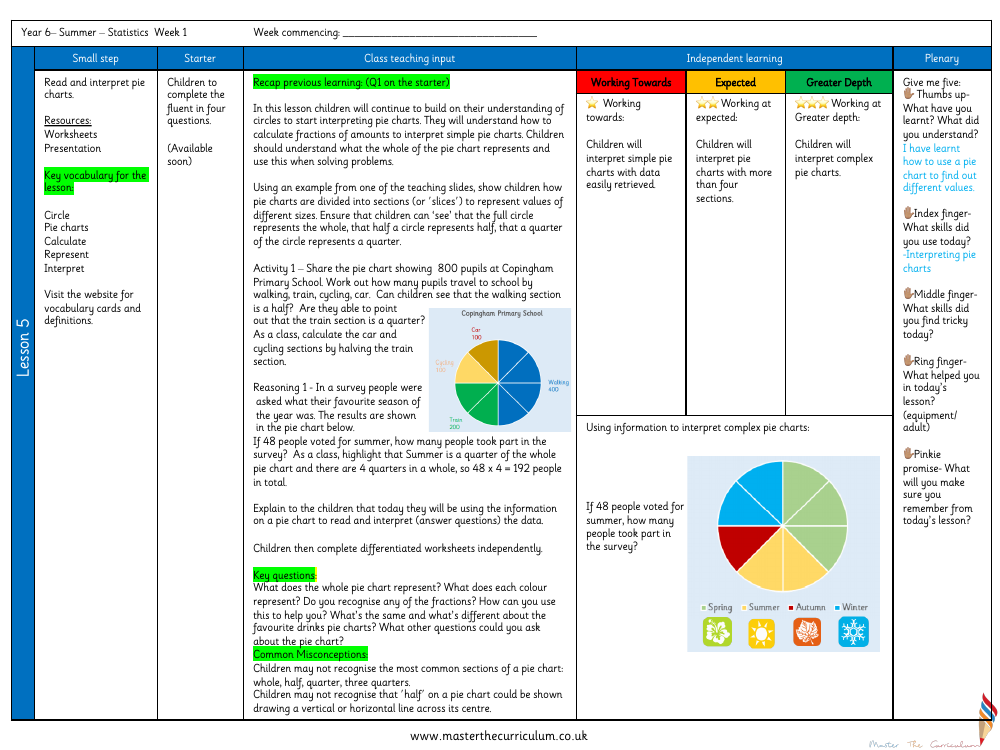
In the Year 6 summer term statistics module, students delve into the world of pie charts, a fundamental aspect of data representation. The lesson aims to enhance their ability to read and interpret these circular graphs. The primary resources provided for this lesson include worksheets and a presentation, which are supplemented by vocabulary cards available on the website. Key terminologies such as 'circle', 'pie charts', 'calculate', 'represent', and 'interpret' are introduced, ensuring that students are familiar with the essential language of the topic. The lesson begins with a recap of previous learning, setting the stage for students to apply their knowledge of circles to the interpretation of pie charts. They will learn to calculate fractions of amounts and use this skill to understand the data represented in simple pie charts.
The teaching input involves demonstrating how pie charts are segmented to reflect different values, with the entire circle symbolising the whole dataset. An example used in the lesson is a pie chart showing the modes of travel for 800 pupils at a primary school, which students analyse to determine the number of pupils using each mode of transport. Further activities include a reasoning exercise where students deduce the total number of survey participants based on the fraction represented by a specific choice. The lesson concludes with independent work on differentiated worksheets, allowing students to consolidate their learning at various levels of complexity, from interpreting simple pie charts to tackling more complex ones. Students are also encouraged to reflect on the skills they've learned and used during the lesson, as well as any challenges they faced, ensuring they understand the importance of accurately reading and interpreting data presented in pie charts.
