Statistics - Draw line graphs - Worksheet
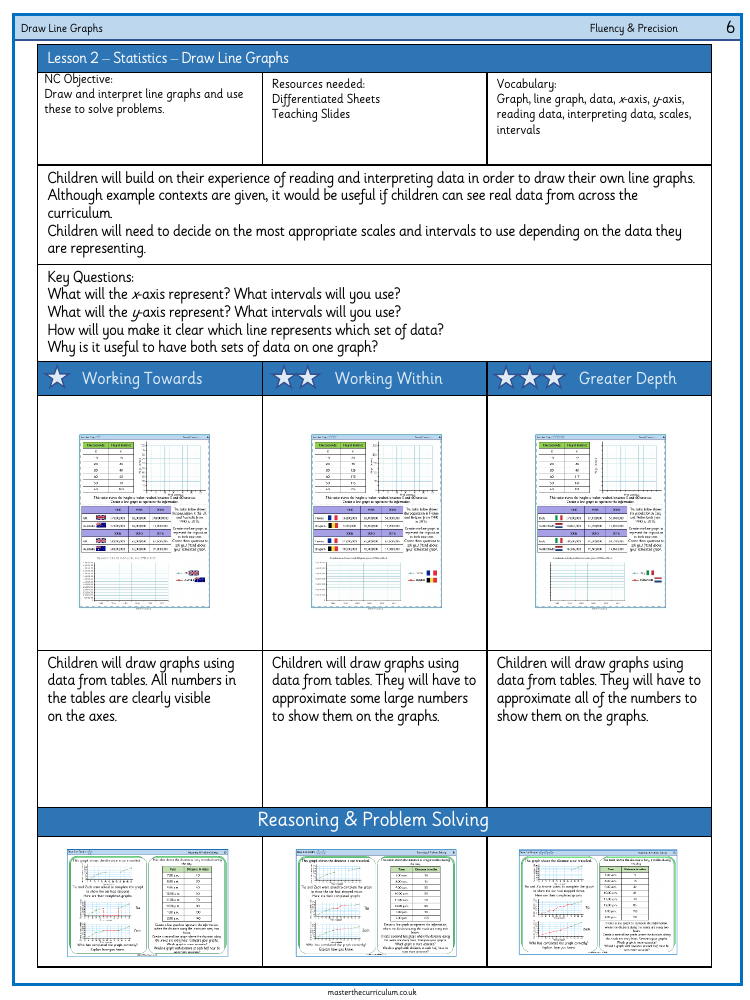
Maths Resource Description
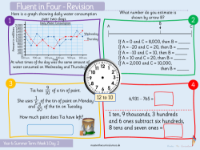
The worksheet on statistics is designed to enhance students' abilities in drawing line graphs, a key skill in interpreting and presenting data effectively. This educational resource provides a practical opportunity for learners to engage with numerical information by plotting points on a graph and connecting them to form lines. The activity requires students to understand the scale, identify the axes, and accurately represent data through the medium of a line graph. This exercise not only solidifies their understanding of statistical representation but also prepares them for analyzing trends and patterns within datasets.
Through the worksheet, students will be given datasets that they need to translate into visual graphs. They must pay close attention to the units of measurement and ensure that each point is plotted correctly according to the given values. Once all points are in place, students will draw lines to connect them, creating a coherent line graph. This task helps in developing their attention to detail and precision, which are crucial skills in the field of data analysis. The worksheet may also include questions that encourage students to interpret the information presented by the line graphs they have created, further enhancing their statistical literacy.
