Statistics - Draw line graphs - Starter
Maths Resource Description
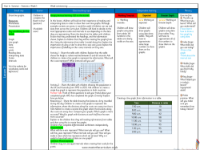
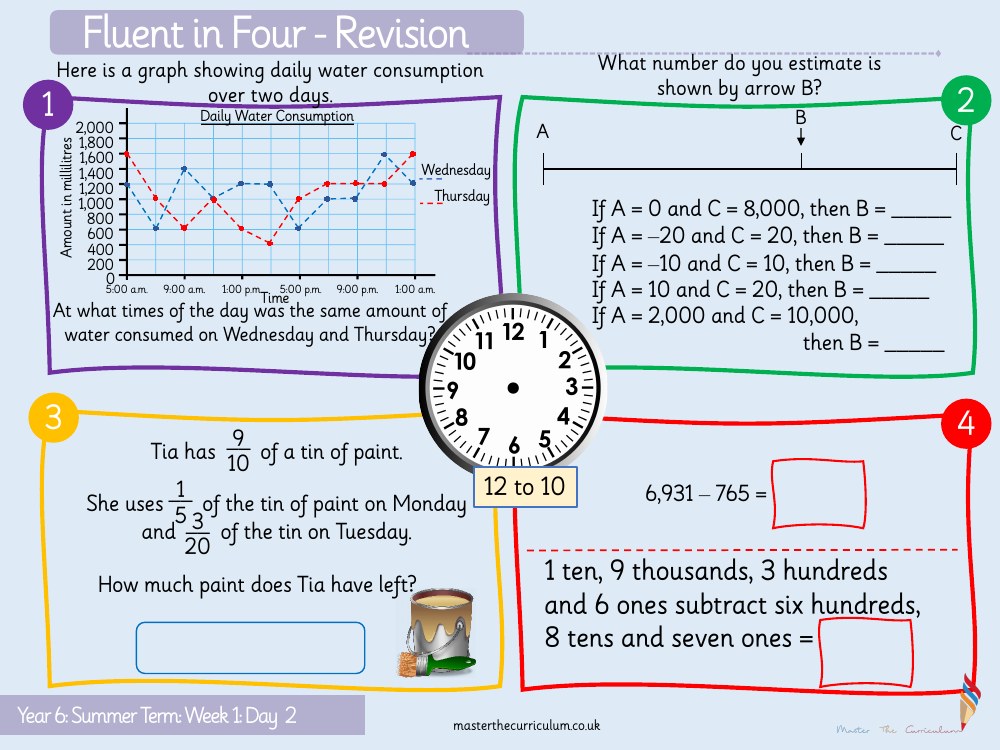
In this Year 6 mathematics session, students are presented with a variety of tasks to enhance their understanding of numbers and graphs. The session begins with a subtraction exercise where pupils are asked to calculate the difference between a number composed of thousands, hundreds, tens, and ones, and another number that is subtracted from it. The specific question involves subtracting six hundreds, eight tens, and seven ones from the number 6,931, with the answer being 6,166. This exercise is part of the 'Fluent in Four' revision, which aims to consolidate students' arithmetic skills.
Another key component of the lesson involves interpreting a line graph that displays daily water consumption across two days. Students are tasked with identifying the times at which the same amount of water was consumed on both Wednesday and Thursday. The graph is marked with time intervals and water amounts in millilitres, providing a visual representation of consumption patterns. Additionally, the lesson includes a practical problem involving fractions, where students must determine how much paint Tia has left after using certain fractions of a tin on Monday and Tuesday. The fraction problem requires students to perform subtraction of fractions to find the remaining quantity of paint. The session also includes an estimation challenge where students must deduce the value indicated by an arrow on a number line, further honing their mathematical reasoning skills.
