Statistics - Assessment
Maths Resource Description
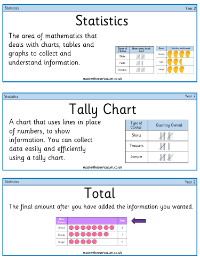
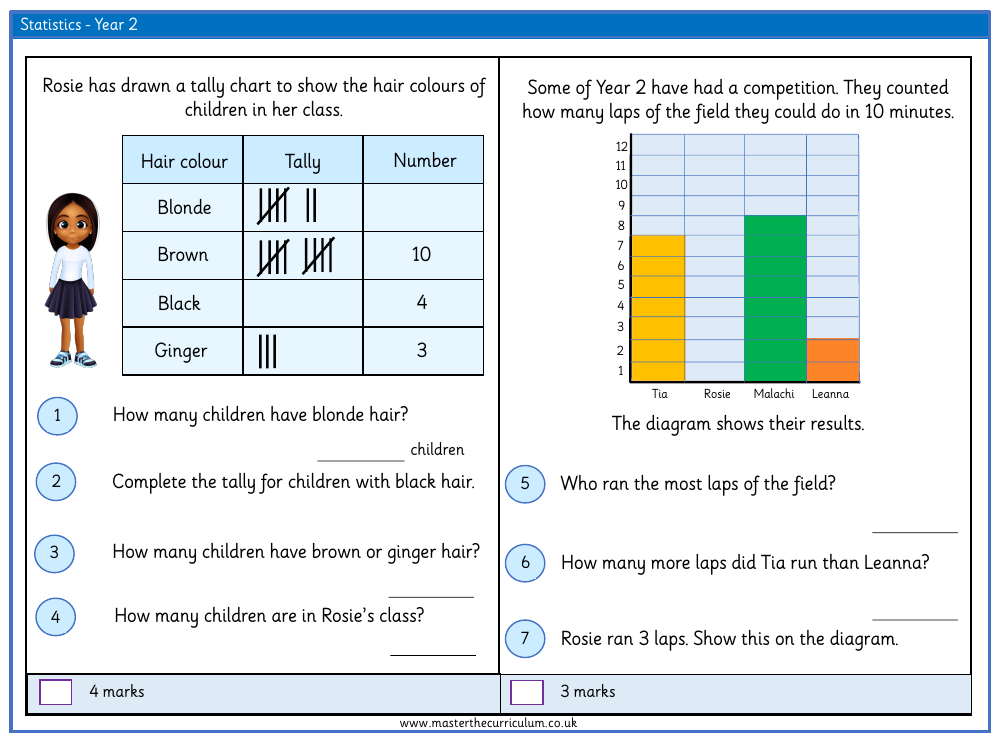
In a Year 2 statistics assessment, students are tasked with various questions that test their ability to interpret data from charts and diagrams. The assessment begins with a question about a tally chart created by Rosie, which categorises the hair colours of her classmates. Students must identify the number of children with blonde hair from the tally. They are also asked to complete the tally for children with black hair and calculate the combined total of children with brown or ginger hair. To further challenge their understanding, they must determine the total number of children in Rosie's class based on the tally chart provided.
Another part of the assessment involves a competition among Year 2 students, where they count how many laps they can run around a field within 10 minutes. The results are displayed in a diagram, and students are required to deduce who ran the most laps. They must also show on the diagram that Rosie ran 3 laps. Additionally, the assessment includes questions about a pictogram that represents the amount of money four children have in their purses, with each symbol equating to £2. Students must calculate how much money Malachi has, the difference in money between Tia and Leanna, and how much money Rosie would have left after spending £2. Another pictogram shows the number of apples that fell from a tree each day, and students are asked to determine the number of apples that fell on Monday and to adjust the pictogram to reflect one more apple falling on Friday than on Thursday.