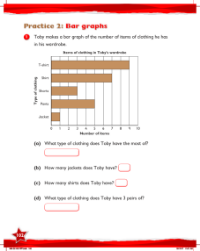
Max Maths, Year 3, Learn together, Bar graphs (3)
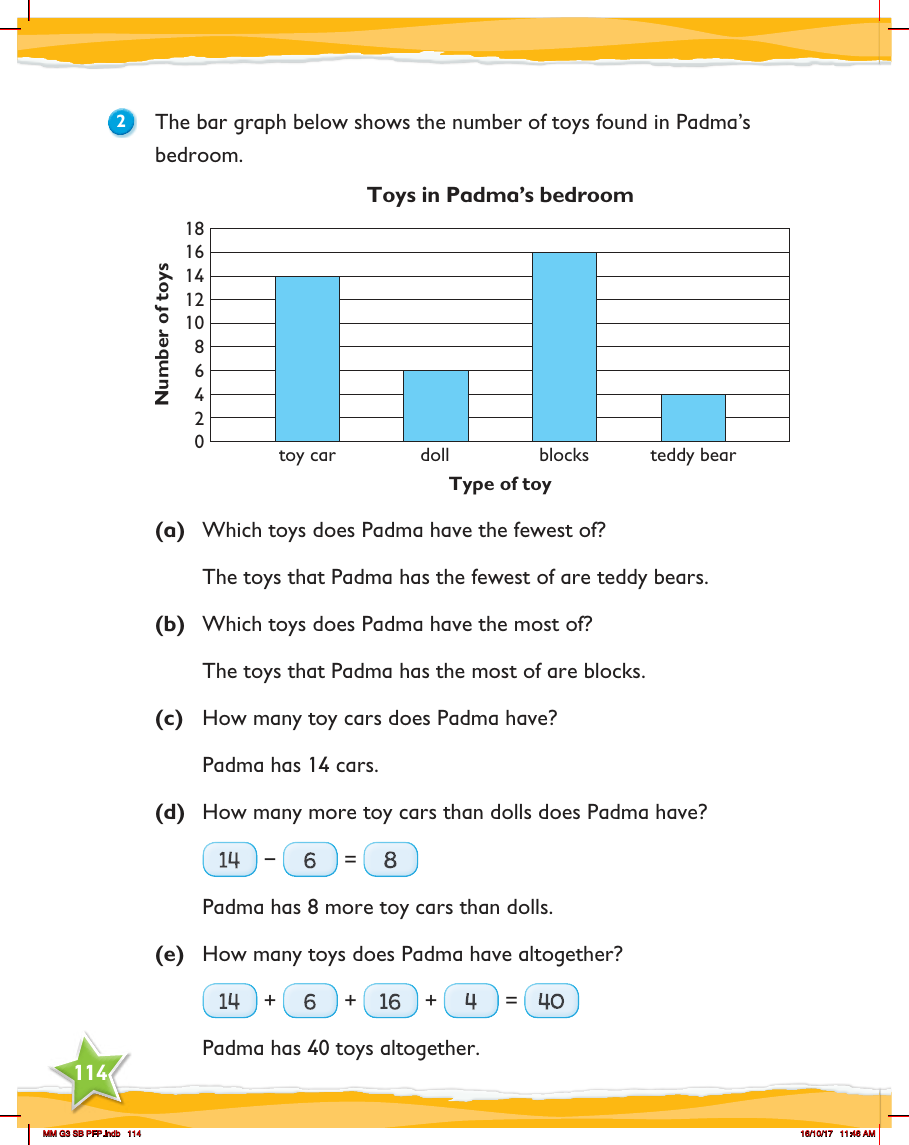

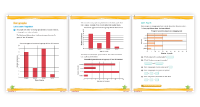
In a Year 3 mathematics lesson, students are introduced to the concept of bar graphs through an engaging example featuring Padma's toy collection. The bar graph provided illustrates the different types of toys found in Padma's bedroom, with categories including blocks, toy cars, dolls, and teddy bears. Each bar's height corresponds to the quantity of each type of toy, allowing students to compare and analyse the data visually. The graph is a practical tool for helping children understand how to interpret and extract information from bar graphs, a fundamental skill in data handling.
From the bar graph, students are asked a series of questions to test their comprehension. They determine that Padma has the fewest teddy bears and the most blocks in her collection. They also calculate the exact number of toy cars, which stands at 14. The exercise further challenges them to compare quantities, as they work out that Padma has 8 more toy cars than dolls. Finally, they demonstrate their addition skills by calculating the total number of toys, which amounts to 40. This activity not only teaches students about bar graphs but also reinforces basic arithmetic operations and comparative analysis.