Max Maths, Year 3, Work Book, Block graphs
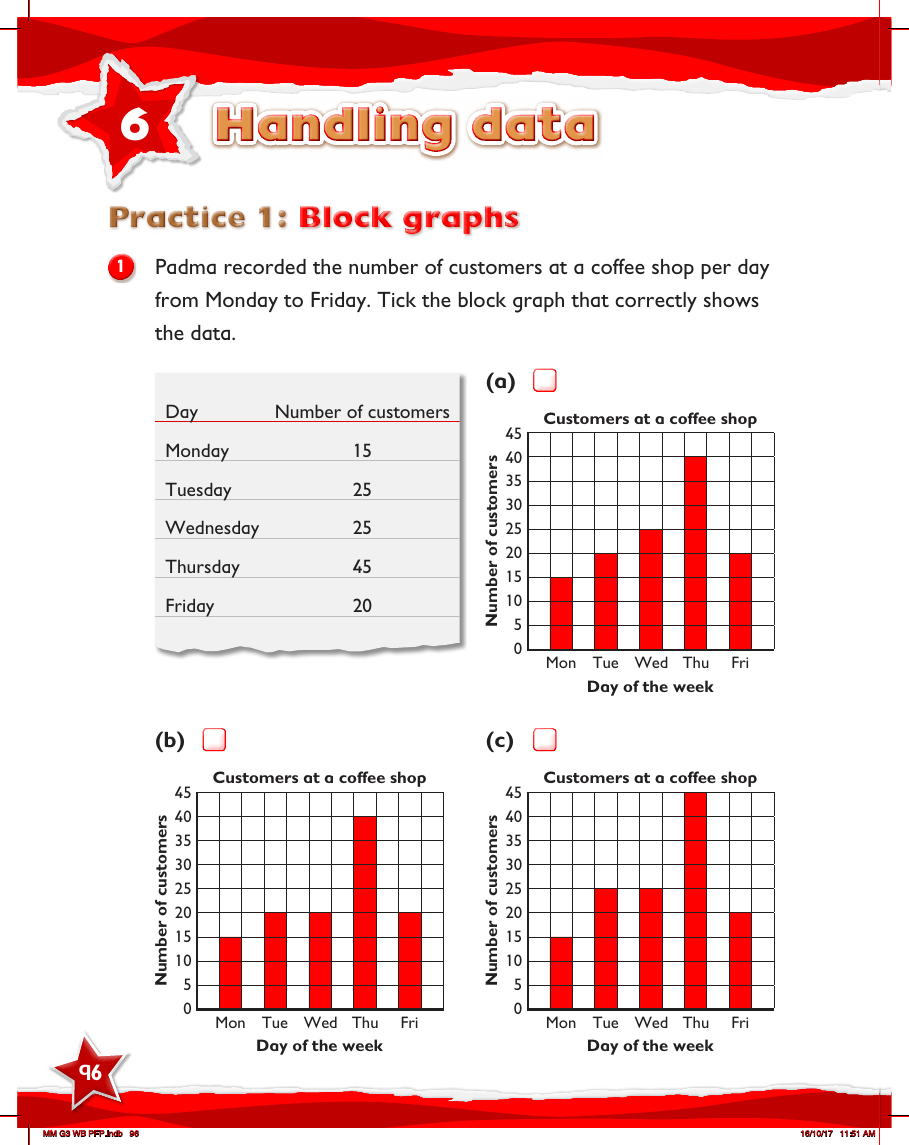

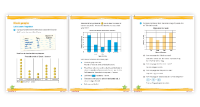
In the Max Maths Year 3 Workbook, students are introduced to block graphs through a series of engaging practice activities. The first activity involves Padma's record of customer visits to a coffee shop from Monday to Friday. Students must examine three different block graphs and tick the one that correctly represents the data given in a table. The table lists the number of customers for each day of the week, with Monday having 15 customers, Tuesday and Wednesday both seeing 25, Thursday peaking at 45, and Friday dropping to 20. This exercise helps students understand how to interpret and construct block graphs accurately.
Another task challenges students to identify the correct table that represents data shown in a block graph about the favourite colours of 3A learners. The graph displays the popularity of five colours—blue, yellow, green, red, and pink—and students must choose the correct distribution of learners' preferences among the options given. Additionally, the workbook includes exercises where students analyze block graphs depicting the sales of different ice cream flavours at a shop, determining which flavour was the most popular, and comparing the number of ice creams sold for each flavour. There are also tasks involving the favourite subjects of Year 3 learners and the mass of seafood sold at a market, where students answer questions based on the graphs, such as which subject or seafood type was most or least popular and calculating totals and differences in sales or preferences.