Max Maths, Year 3, Try it, Block graphs
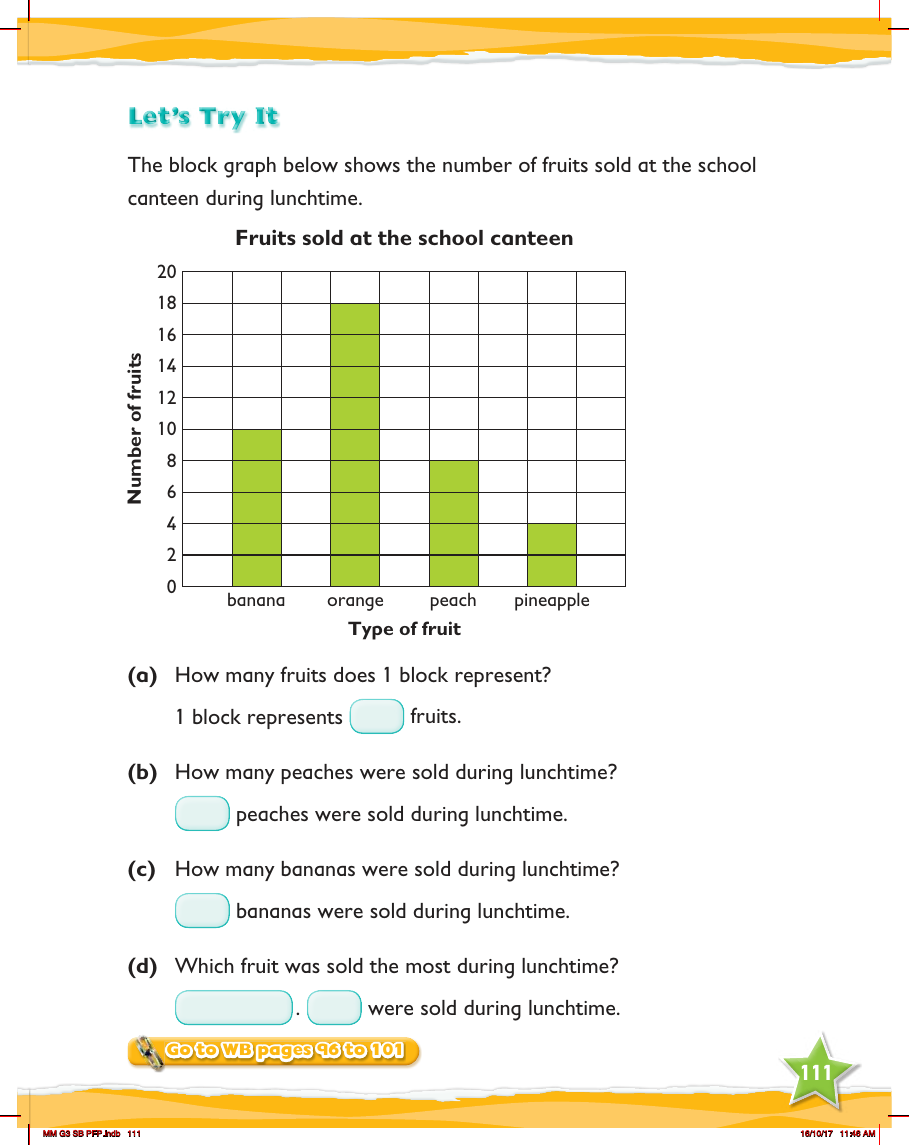

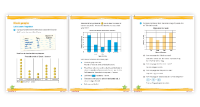
In a practical exercise designed for Year 3 pupils, they are introduced to interpreting block graphs through a real-life scenario involving the sale of fruits at a school canteen. The block graph provided displays the quantities of different fruits sold during lunchtime, with fruits like bananas, oranges, peaches, and pineapples being represented. The graph is labelled with numbers along the vertical axis indicating the number of fruits, and types of fruits are listed along the horizontal axis.
Students are tasked with several questions to test their understanding of the block graph. They must determine the value of one block on the graph, count the number of blocks to find out how many peaches and bananas were sold, and identify which fruit was the most popular during lunchtime. These questions are aimed at enhancing the pupils' ability to read and interpret data from a block graph, a fundamental skill in mathematics. For further practice and reinforcement of the concepts, students are directed to workbook pages 96 to 101.